MS Chromatogram window
The MS Chromatogram window is used on GC-MS and LC-MS instruments instead of the standard Chromatogram window. It offers similar functionality but includes specific features related to mass spectrometry. This section focuses only on the differences and additional features specific to the MS Chromatogram window.
MS Chromatogram window
Spectral graph
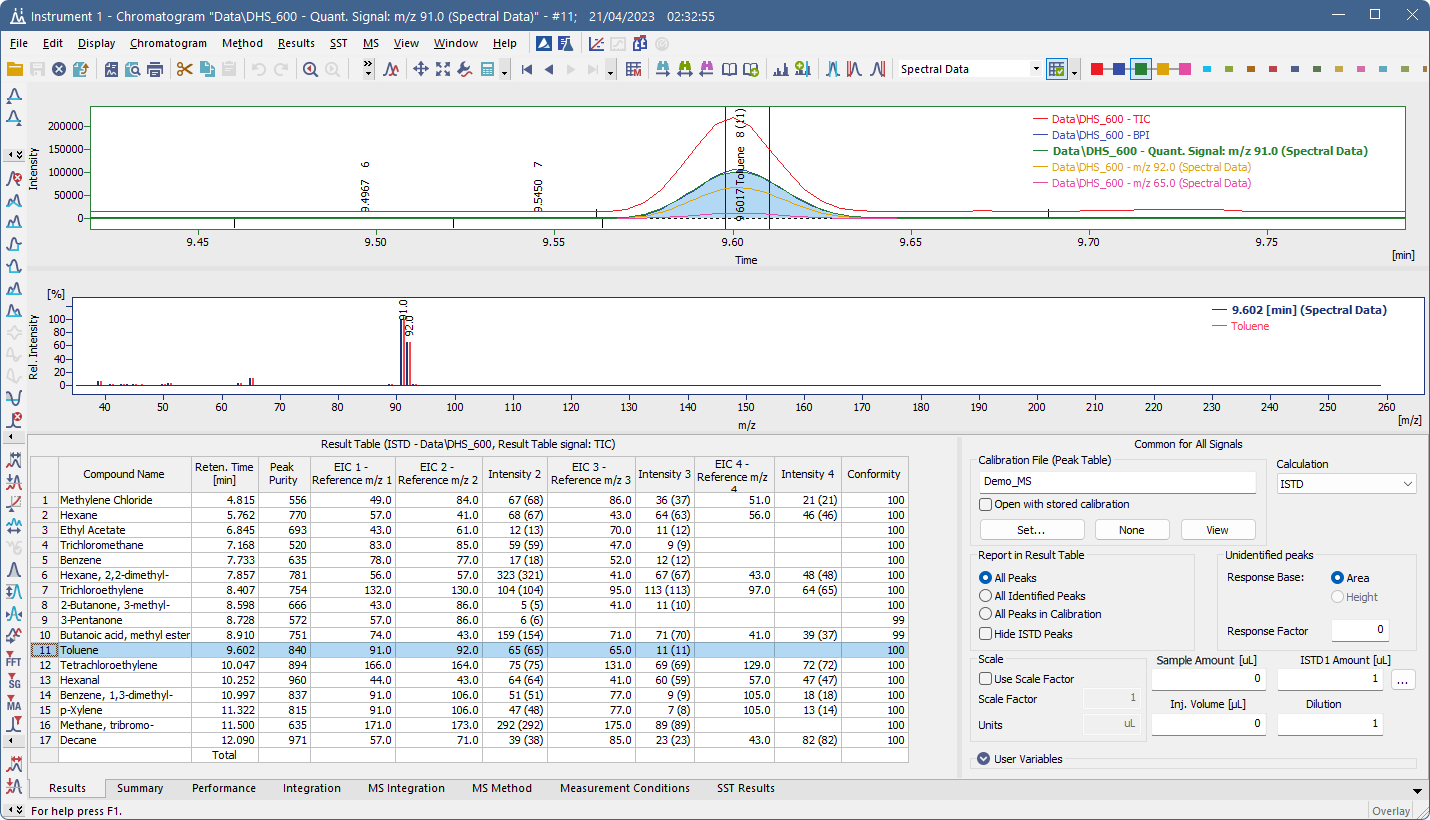
The graph area in the MS Chromatogram window is divided into two parts:
- Chromatogram (top graph) – displays selected signals over time, such as TIC (Total Ion Current), BPI (Base Peak Intensity), quantification m/z and reference m/z signals.
- Spectrum (bottom graph) – shows the mass spectrum corresponding to the currently selected peak or time range.
When a compound is selected, its spectrum is displayed in the spectral graph. A compound can be selected by clicking on it in the chromatogram, or by selecting a row in the Result Table or in the MS Method Table. Selecting a compound in the chromatogram automatically highlights it in the tables, and vice versa. If a library spectrum is available, the spectral graph also displays the matching library spectrum in an overlay.
To view the spectrum for any chromatogram section, use the MS - Show Spectrum command.
By default, the spectrum shows relative intensity vs. m/z. You can change this to absolute intensity or adjust label settings in the Graph Properties - MS Spectra dialog (via the Properties… local menu command).
The Select Spectral Data drop-down can be used to select displayed spectral data when multiple of them are stored in a chromatogram.
MS Offsetting
A special display mode called MS Offsetting lets you visually align signals to the same baseline while keeping their relative intensities. This is useful for comparing signals (e.g. TIC vs. reference ions) and minimizing background noise. You can enable it in the Graph Properties - Signals dialog.
Signals in MS Extension
The type and number of displayed signals depend on the selected compound. Different peaks can have different quantification and reference signals and the visible signals may update dynamically based on the current selection.
Signals appear in the following order:
- Standard signals defined in System Configuration or Method Setup.
- Quantification signal of the selected peak – this can be one of the reference m/z signals, TIC, their sum, or even an external signal.
- Reference ion signals of the selected peak. If a reference ion is also used as a quantification signal, it is shown only once.
- User-created temporary signals – additional signals generated on-the-fly from raw data.
A maximum of 32 signals can be displayed for one MS chromatogram. This includes standard, reference, TIC, BPI, external and temporary signals. It is not possible to display temporary signal that would exceed this number.
Temporary signals are created on-the-fly from raw data and are not part of the chromatogram file itself. They are visible only on MS instruments and are regenerated whenever needed.
They include:
- All EIC (Extracted Ion Chromatogram) signals used for reference or quantification
- Any summed signals derived from multiple m/z values (e.g. sum of references)
- User-defined signals created by Add Temporary Signal command. These signals disappear after you close the Chromatogram window and have to be set again if needed.
View Menu
Maximize Spectrum
The command maximizes the spectrum to cover the entire window (hides the bottom tabs). Double click near the splitter (the cursor will change to  ) to achieve the same effect.
Show All
The command restores default view showing chromatogram, spectrum and the bottom tabs.
MS Measurement Conditions
On the Measurement Conditions tab of the MS Chromatogram window, Show MS Conditions… button is available. This opens the MS Measurement Conditions dialog, which displays information provided by the MS detector control module.
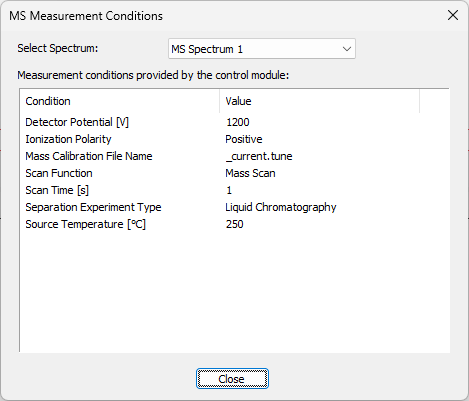
MS Measurement Conditions dialog
More MS features in Chromatogram window
Changes and new features specific to the MS Chromatogram window that require additional explanation are described in these dedicated sections: