MS Menu
Menu containing all commands available in the MS Extension.
| Icon | Command | Description |
| MS Integration | Switches the display of the lower part of the MS Chromatogram window to the MS Integration tab, showing Integration Table for compound's quantification signals. | |

|
MS Method | Switches the display of the lower part of the MS Chromatogram window to the MS Method tab. |
| Set NIST Libraries Directory… |
Allows to set the correct location of the NIST Libraries, if they are installed on the computer. Clarity installation includes basic NIST demo libraries stored in the \Datafiles\NIST\ subdirectory of the Clarity working directory (C:\CLARITY\ by default), which can be used instead. It is necessary to select the folder that contains the libraries, with each library represented as a subdirectory. This is required for Clarity to function correctly. |
|
| Select Spectral Data | Command for working with multiple spectra in a single chromatogram. Opens a sub-menu allowing to switch to different spectrum. The same action may be also performed from the select-box in the MS toolbar. | |
| Prefer Spectral Data from Method | Command for working with multiple spectra in a single chromatogram. It defines whether, for compounds already present in the MS Method, the displayed spectrum is the one selected in the method. By default this option is checked, meaning that while the focus changes to different compound defined in the MS Method, "active" spectral data chosen in the Select Spectral Data dropdown will change. | |

|
Single Compound Search… | Changes the cursor so you can select a retention time in the chromatogram. After you mark the region, the corresponding spectrum is taken and the MS Search dialog opens on the Single Compound Search tab. |

|
Automatic Compound Search… |
Opens the MS Search dialog on the Automatic Compound Search tab. |

|
Target Compound Search… |
Opens the MS Search dialog on the Target Compound Search tab. |

|
Manage Libraries… | Opens the MS Search external program which allows to create user libraries, manage them and copy compound spectra to them. |

|
Add Spectrum to Library… |
Sends the selected spectrum to the MS Search external program via Add MS Spectrum to Library dialog |

|
Show Spectrum |
Allows to display a spectrum at any given time or any time interval. Invoking this command locks the cursor in the graph pane - just clicking on the time shows the spectrum at that point, pressing Ctrl and clicking twice allows to select the time interval through which the spectrum will be averaged. |

|
Add Reference m/z | When you are in a MS Method Table row, using this command locks the cursor in the spectrum graph. Clicking on any m/z stick adds the given m/z ion as a reference m/z for the compound. When all four reference m/z ions are filled in, you need to delete one of the four reference m/z ions before adding a new one. |
| Add Compound w/o Library Spectrum… |
When invoked, locks the cursor in the chromatogram graph pane. Clicking on any time will invoke the Add Compound w/o Library Spectrum dialog described in the section Add Compound w/o Library Spectrum |
|
| Add Selected m/z Signal as Temporary | Using this function locks the cursor in the spectrum graph. Clicking on any m/z will add the extracted signal of that m/z to the chromatogram if maximum signals in the chromatogram is not achieved yet. | |
| Add Temporary m/z Signal - Manually… |
Using this function invokes the Add Temporary m/z Signal Manually dialog described in the section Add Temporary m/z Signal - Manually… allowing to extract the signal on any chosen m/z from the raw data. It is possible to get a signal for the range of several defined m/z values. Manual Temporary signal is created only if there is free signal slot available in the chromatogram. |
|
| Remove All Temporary m/z Signals | Serves for removing all user-added temporary signals from the display in the MS Chromatogram window. | |
| Mean and Backgrounds | Command opening sub-menu with commands used for setting the mean and background evaluation intervals. | |

|
Set Mean Calculation Interval | Using this function locks the cursor in the MS chromatogram graph. Clicking on any time point sets the start of the mean calculation interval, clicking for the second time selects the end of the mean calculation interval. Both values are inserted into the MS method of the chromatogram for the given peak in the format specified in Mean and Backgrounds dialog. |

|
Set Background 1 Interval | Using this function locks the cursor in the MS chromatogram graph. Clicking on any time point sets the start of the background 1 interval, clicking for the second time selects the end of the background 1 interval. Both values are inserted into the MS method of the chromatogram for the given peak in the format specified in Mean and Backgrounds dialog. |

|
Set Background 2 Interval | Using this function locks the cursor in the MS chromatogram graph. Clicking on any time point sets the start of the background 2 interval, clicking for the second time selects the end of the background 2 interval. Both values are inserted into the MS method of the chromatogram for the given peak in the format specified in Mean and Backgrounds dialog. |
| Configure Mean and Backgrounds… | Opens the Mean and Backgrounds dialog, used to set the defaults for mean calculation interval and background intervals. | |
| Create Spectrum Label | Creates labels in the MS spectral graph. Two options enable to create either Text labels or Line labels. | |
| Switch MS Warnings Off | Using this option hides MS Extension related warnings above the Result Table in the MS Chromatogram window. |
Add Compound w/o Library Spectrum
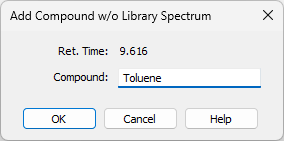
Add Compound w/o Library Spectrum dialog
The dialog allows to enter a new row into the MS Method Table. Selecting a unique Compound name is necessary.
Add Temporary m/z Signal - Manually…
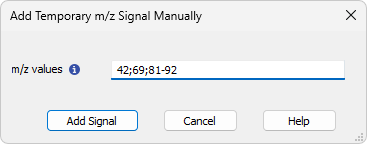
Add Temporary m/z Signal - Manually…
The dialog invoked after using the Add Temporary m/z Signal - Manually… command allows to extract the desired m/z signal from the raw data. Any values complying with spectral precision are allowed to be entered into the dialog, the values can be input as single values separated by semicolon (;) or as a range using dash (-). E.g.: 42;69;81-92.