MS Method
MS Method tab in the MS Chromatogram window is used to set up the method parameters.
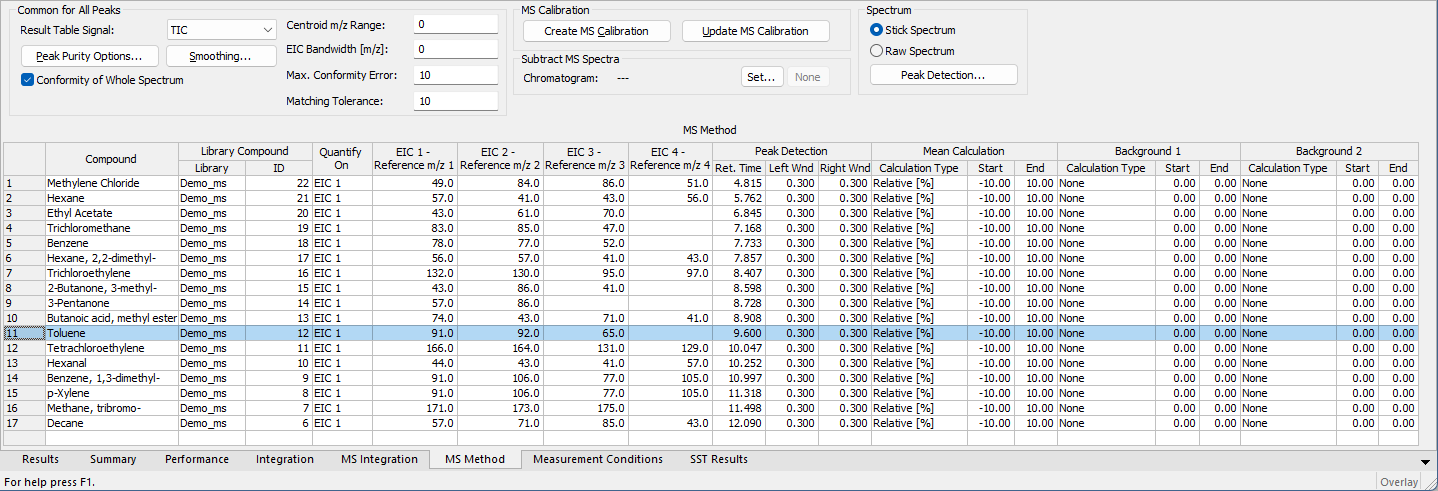
MS Method tab
Items in this section are common properties of all peaks defined in the MS Method and shown in the Result Table.
Sets the signal for the display in the Result Table. MS Result Table is the superposition of a standard signal (set in this field) and peaks defined in the MS Method Table. The default value is TIC signal.
Using the button invokes the MS Method - Peak Purity dialog used for defining the calculation method of Peak Purity value (displayed in the Result Table).
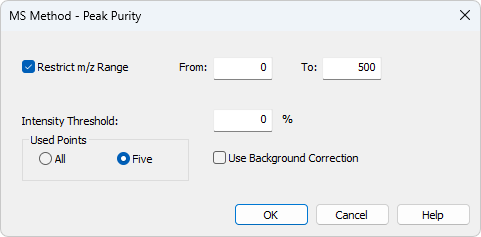
MS Method - Peak Purity dialog
Restricts the comparison of the spectra only to the m/z range specified in the From and To fields.
This parameter specifies the section of a peak, expressed as a percentage of the detected peak height, used for peak purity evaluation. It defines the interval where spectra are included in calculations.
Sets whether the calculations of peak purity value will be carried out based on spectra in All peak data points or only Five significant points, which are:
- the peak purity start (located in one-third of the distance between the start point of the interval set by Intensity Threshold and peak apex)
- the peak purity inflexion point (in two-thirds of the distance between the start point of the interval set by Intensity Threshold and peak apex)
- the peak apex
- the other peak purity inflexion point (in one-third of the distance between the peak apex and end point of the interval set by Intensity Threshold)
- the peak purity end (in two-thirds of the distance between the peak apex end point of the interval set by Intensity Threshold)
With the Use Background Correction checked, the spectra are compared against a corrected baseline. The corrected baseline (background) for individual m/z values is interpolated between the peak start and peak end points.
Clicking the button opens the MS Method - Spectrum Smoothing dialog. It is used to define how MS spectra are displayed. The available options are None, FFT Filter, Savitzky-Golay Filter and Moving Average filter. The last two allow to set the Window on which the smoothing will be applied - the higher the Window value, the smoother the data will be. Side effect of such operation is increased noise and in some cases, shift of the spectral lines on the m/z axis.
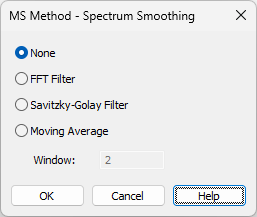
MS Method - Spectrum Smoothing dialog
Sets whether the Conformity values in the Result Table will be calculated just from defined Reference m/z values or from the whole spectra. Calculating with the whole spectra is more precise, but also slower.
Allows to artificially lower the precision of calculating the m/z stick intensities and values. Default value is 0 (as in the data).
Allows to define the allowed imprecision of m/z values to be still considered in the same m/z stick.
Note:
If the Centroid m/z Range is set to 1 (m/z sticks shown in the Spectrum Graph are with the e.g. 40, 41, 42, ...) and EIC Bandwidth [m/z] is set to 0.2, any spectrum containing data with 0.1 imprecision to the expected value will be considered as having that ion in. For example, any spectrum containing m/z line of 159.9 - 160.1 will be considered to have a stick of m/z 160.
Sets the value of maximal error in spectra conformity calculations. This value is used in the Result Table for the calculations of Conformity and also relative Intensity of reference m/z ions.
Sets the tolerance for the peak maximum position to match peaks in the Result Table Signal is matched to a peak as defined in MS Method Table. The value is defined as a percentage of the Left Wnd and Right Wnd compound property, as defined in the MS Method Table. Default value is 10 %.
This section serves for creating and maintaining calibration files from information already filled in MS Method.
Using the button creates a new calibration file and fills it with information already entered into the MS Method table. Columns being filled in the MS Calibration file based on the data in the MS Method are Compound Name, Quantified On, Retention Time, Left Window, Right Window and Peak Selection.
The button is only active when a calibration file is already connected to the MS Chromatogram. Pressing it updates the calibration file with compounds which are present in the MS Method but not in the calibration. Compounds already present in the MS Calibration file get the information in the Quantified On, Reten. Time, Right Window, Left Window and Peak Selection updated. In certain situation (when using Best Match in Peak Selection or Weighted EIC Sum in Quantify On) spectral information is required and it is updated as well. The responses and amounts of those compounds are not influenced in any way. Compounds present in the calibration, but not in the MS Method table, are not influenced in any way.
The button is disabled when MS Chromatogram is opened with Stored MS Calibration and tooltip is displayed next to it.
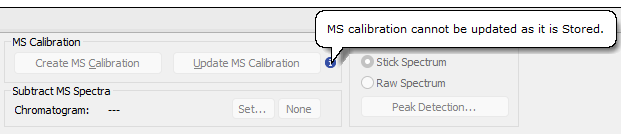
Displayed tooltip for Stored MS Calibration
Serves for setting the subtraction chromatogram (most probably the blank) for signal subtraction. No scaling or moving of any data points is performed, just simple subtraction. If multiple spectral data sets are present in the chromatograms, subtraction is performed pair by pair: the first spectrum of the subtraction chromatogram is subtracted from the first spectrum of the opened chromatogram, the second from the second, and so on. If the spectral data do not have the same spectral parameters (Start m/z, End m/z, m/z Step, data frequency), a bi-linear interpolation is performed on the chromatograms prior to the subtraction.
Section defining the way how spectra are displayed in the spectral graph. The user may want to display the spectra in:
The display options for both modes are set in the Graph Properties - MS Spectra dialog, accessible through local menu of the spectrum graph.
Using the button invokes the MS Method - Peak Detection dialog used for defining of the MS Spectra peak detection mechanism - deciding on placing representative m/z sticks into the raw spectra while in Raw Spectrum display mode.
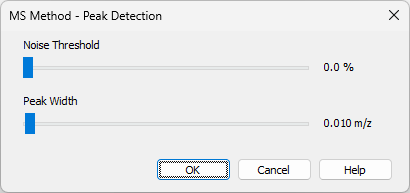
The mechanism is simplified peak detection mechanism only using two parameters for the whole spectra - Noise Threshold and Peak Width. Both parameters are set using sliders.
Sets the noise threshold for the detection of the peaks - the higher the value, the less peaks will be detected in the spectrum.
Sets the peak width parameter for the detection of the peak. This value is dependent on the spectrum precision of the MS detector - the denser the spectra are, the better peak detection can be achieved. Higher values of Peak Width will cause in fewer peaks detected.
Note:
While setting the peak detection parameters, it is necessary to be careful. Wrong settings may invalidate any stick representations of the peaks, among other things (sticks representing the peaks in spectrum will be clearly off if wrong parameters are set).
The table defining the MS Method parameters. Rows in the table correspond to compounds of interest. It is possible to add the compounds into the table either manually (by editing the last empty row) or by using the Single Compound Search  , Automatic Compound Search
  and Target Compound Search
  functions from the MS Menu.
Shows the name of the compound. The name is by default taken from the MS Library if the user uses the library search, but can be changed. Each row in the MS Method Table must have a unique Compound name.
Selects which spectral data are used to work with the given compound. The column is hidden by default and is filled in with currently active spectral data at the moment of compound's creation, but can be changed later. Even for compounds quantified on external signals, the column is used to provide the source for reference EIC signals.
Note:
Within the MS extension, it is possible to work with a chromatogram that contains no spectral data - this may happen for example when the MS detector is switched off in the method but a different detector is left active. Compounds found on such external signal can still be quantified even without the presence of spectral information if their Quantify on is set to external signal as well.
Sets the link to the MS library used in the compound evaluation. The link is defined by the Library name and compound ID. If no spectral libraries are used, the Library column will be empty and the ID will be set to 0 for the compound.
Note:
The columns are colored yellow when Raw spectra are displayed (Raw Spectrum mode, no library spectra used). Cells in a row may be highlighted in red to warn that either: the compound ID specified in Library Compound column is not available in the defined library, or that the library itself is not at the expected location.
Defines on which signal will the particular compound be quantified. The options are any of the four reference extracted ions (EIC1..4), EIC Sum, Weighted EIC Sum or any standard signals defined in the method (either from the MS detector, which usually includes TIC, or from external detector). The default option is EIC1.
Note:
Spectrum and spectrum related information are necessary for using Weighted EIC Sum.
Columns for setting up the reference m/z ions for compounds in the MS Method Table. The values for m/z ions may be entered either manually or interactively using the Add Reference m/z function from the MS Menu
This section of the MS Method Table serves for setting the areas of the chromatogram where the given peak will be searched for. The meaning of the Ret. Time, Left Wnd and Right Wnd and Peak Selection is the same as described in the Calibration Table of the Calibration window.
Retention time and windows define the expected peak retention time and a span to lower and higher retention times, respectively, to search for the peak.
Peak Selection column (hidden by default) defines which peak will be taken if more than one is found in the given time interval on the specific quantification signal. The options are peak Nearest to the expected retention time, First peak in the interval, Last peak in the interval, Biggest peak in the interval (based on Response Base settings in the MS Calibration) and the peak with the Best Match of it's spectrum to the expected library spectrum that is in the interval. Nearest is the default option.
Caution:
Left Wnd and Right Wnd define the search interval on the quantification signal which is specified for compound. When two (or more) compounds are quantified on the same signal and their Windows are set in a way they would overlap, the Windows are shortened so no overlap happens. On the other hand, Windows of compounds quantified on different signals do not influence each other in any way.
Mean Calculation section of the MS Method Table is used to define how the peak spectrum - later used for spectral comparison with the library spectrum - is calculated. The Calculation Type defines the means of the calculation, the Start and End columns the boundaries. The following Calculation Types are available:
- None - a single spectrum from the peak apex is taken.
- Relative [%] - the spectrum shown and compared is calculated as the average spectrum over the interval from Start to End. The values entered into these fields are expressed as percentages of the peak length, with –100 representing the peak start, 0 the peak apex, and 100 the peak end.
- Relative - Peak Apex [min] - the spectrum shown and compared is calculated as the average spectrum over the interval from Start to End. The values entered are times in minutes relative to peak apex - negative values mean retention time lower than peak apex, positive values retention time higher than peak apex.
- Absolute [min] - the spectrum shown and compared iis calculated as the average spectrum over the interval from Start to End The values entered are absolute retention times.
The default settings are Relative with Start of –10, End of 10. There are restrictions on possible values entered into the fields - the time entered into the Start column must be lower than the time in the End column for the compound. The values and Calculation Type may be filled in either manually by entering the values into the cells, or using the  Set Mean Calculation Interval function.
Background 1 and Background 2 section of the MS Method Table serves for defining the background spectra used for subtraction from the spectrum of the peak. The subtracted spectrum is used for the comparisons with the spectral libraries and for the display. The Calculation Type defines the means of the calculation, the Start and End columns the boundaries. The following Calculation Types are available:
- None - no spectrum is subtracted.
- Relative [%] - spectrum being subtracted is calculated as an average of the spectra in the interval from Start to End. The values entered into these fields are in percent from the peak beginning to peak end, –100 representing peak start, 0 peak apex and 100 peak end. Values lower than –100 and higher than 100 are allowed.
- Relative - Peak Apex [min] - spectrum being subtracted is calculated as an average of the spectra in the interval from Start to End. The values entered are times in minutes relative to peak apex - negative values mean retention time lower than peak apex, positive values retention time higher than peak apex.
- Relative - Peak Start [min] - same calculation as for Relative - Peak Apex option, only the referenced time point is the peak start, not peak apex.
- Relative - Peak End [min] - same calculation as for Relative - Peak Apex option, only the referenced time point is the peak end, not peak apex.
- Absolute [min] - spectrum being subtracted is calculated as an average of the spectra in the interval from Start to End. The values entered are absolute retention times.
The default settings are None. In case both Background intervals are defined, the calculated spectrum is an average of the two background spectra, if just one interval is defined, the spectrum subtracted is fully defined by it. The values and Calculation Type may be filled in either manually by entering the values into the cells, or using the  Set Background 1 Interval and
  Set Background 2 Interval functions.
Note:
Using the Background intervals will make the processing of MS chromatograms and work with them slower.