Result Table
Result Table in the MS Extension contains several columns that are not present in standard Clarity. These columns are described below the picture. Also, some columns from standard Result Table are not available in the MS Extension.
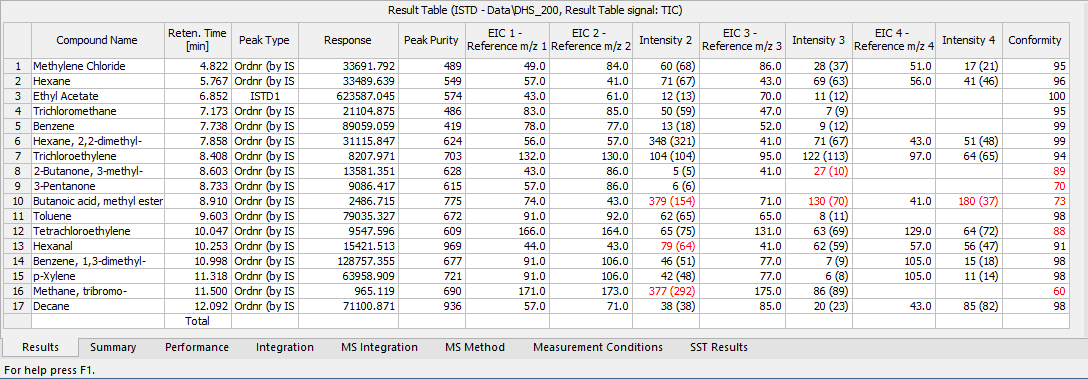
Result Table - MS Chromatogram
The compounds and values in the Result Table are taken from various sources:
- from the MS Calibration
- from the MS Method for compounds not present in the MS Calibration (these appear without amounts)
- from detector signal peaks that match neither MS Calibration nor MS Method, in which case most fields remain empty
Shows the spectral similarity of a particular spectra contained in the peak, as defined by parameters set in the MS Method - Peak Purity dialog accessible from the MS Method tab. If Peak Purity is calculated using the Five points method and the Intensity Threshold is set too high (above the peak inflection points), an error message is shown together with a tooltip suggesting a solution.
If the chromatogram does not contain spectral information, the spectral information are not selected for the compound in the MS Method Table or the peak quantified on the external signal is outside of the spectrum range, the Peak Purity value will not be calculated.
Displays the m/z of the particular reference ion as set in the MS Method Table.
Displays the relative intensity of the given reference m/z ion stick to the first reference m/z ion stick. The value in the parentheses is displaying the expected relative intensity calculated from the library spectrum of the compound. If the value of the relative intensity is too different from the expected value, the cell contents are displayed in red. The limit for "too different" is set by the Max. Conformity Error parameter on the MS Method tab. If the expected relative intensity is below 100, the value is considered an absolute limit. If the expected value is above 100, the value entered in the Max. Conformity Error field is considered a relative limit in %.
Displays the numerical score showing how similar a compound's spectrum is to library spectrum assigned in the MS Method Table, on the scale of 0 (completely different) to 100 (identical). If the Conformity value is too low, the value is displayed in red. The limit for "too different" is again set by the Max. Conformity Error parameter on the MS Method tab.
Note:
The result is also influenced by the setting of the Conformity of Whole Spectrum checkbox on the MS Method tab - while it is checked, the conformity of the whole spectra is compared, while when the checkbox is unchecked, the conformity is only calculated from the reference m/z ions.
There are several MS Extension related warnings that can be displayed above the result table. For example warnings are displayed when settings for a compound differs in MS Method and MS Calibration, when spectrum is missing but is required (using options Best Match in Peak Selection or Weighted EIC Sum in Quantify On) or when a compound is present in MS Calibration but missing in MS Method. These can be turned off by using option MS - Switch MS Warnings Off.