Calibration - Compounds tab
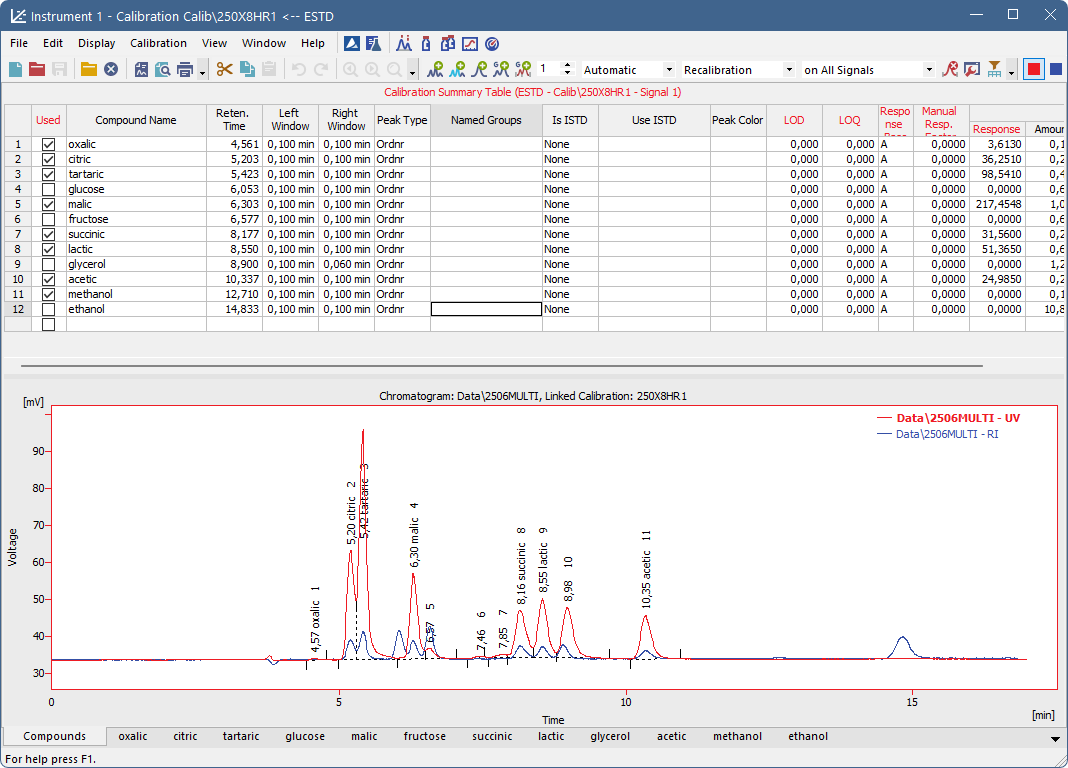
The name of the current calibration file is displayed in the window header of the Calibration window. When displaying calibration curves saved in the chromatogram, the header contains the name of the chromatogram and the date the displayed calibration curves were saved. The window contains the main Compounds tab as well as tabs of every compound which is defined in the opened calibration file. The Compounds tab contains the main calibration table and graph area for the calibration standard chromatogram. The Individual Compound tabs contain a table for the displayed compound, several parameters and its calibration curve.
Click on any area of the image below to get relevant information
Calibration - Compounds
Compounds tab
Overview tab that contains Notification area, Calibration Summary Table and a view of the standard chromatogram.
Notification area
The area above Calibration Summary Table contains some basic information on the opened calibration file (calibration name, the display mode and the active signal). Below the information on the table is an area where warning messages appear if something is not set correctly in the calibration file. Up to two lines are reserved for the warning messages, if more messages should be displayed, they are signaled by ... sign at the end of the last line and can be viewed in a tooltip over the notification area.
Note:
Not all problems of the calibration have warning messages at the moment, further warnings will be added in future versions.
Calibration Summary Table
The Calibration Summary Table provides an overview of all compounds across all signals. Any row corresponds to one compound or group of compounds. Some columns, such as Compound Name and Reten. Time, are shared across all signals, while others are specific to the currently active signal and are displayed in its color. Additionally, some of these signal-specific columns apply only to the currently displayed calibration level.
In the table below, there is description of each column present in the Calibration Summary Table:
| Column | Description | Applies To |
|
Row header with the numbering of compound according to retention time. A double-click on the row header switches the view to the tab of the corresponding compound. |
All signals | |
| Used |
Controls whether a compound is included in quantification and calibration – only compounds with the Used checkbox checked will be (re)calibrated, while unchecked compounds are excluded. If multiple compounds share the same retention time on a single signal, only one of them can have the Used checkbox checked; otherwise, a warning message is displayed. This column is especially useful in multi-detector chromatograms, where each compound is assessed on one signal and can be hidden from the results table for the remaining signals using this selector. |
Active signal |
| Compound Name |
Name of the compound. If a compound is added from a standard chromatogram (either using commands like Add All in the Calibration window or automatically after measuring a standard chromatogram) it is named "Peak [retention time]" by default. If a new compound is created directly in the table (e.g., by filling in Retention Time), no default name is pre-filled. |
All signals |
| Reten. Time | Retention time of the compound. It is used for compound identification. | All signals |
| Search Window |
Defines whether the search window for a compound is specified in absolute values (Abs, set in minutes) or relative values (Rel, set as a percentage of the retention time). When a new compound is added, the default value is pre-filled based on the Calibration Options - Defaults tab. This column is hidden by default, For more details see also chapter Setup Columns |
All signals |
| Left (Right) Window |
Defines the width of the left (right) window for identification of compounds. At any given time point, only one Search Window can be applied. If multiple search windows are set to overlap, they will be shortened accordingly. This shortening is not reflected in the table. When a new compound is added, the default value is pre-filled based on the Calibration Options - Defaults tab. |
All signals |
| Peak Selection |
Determines how the peak is identified when multiple peaks appear within the identification window. The available options are:
The Peak Selection setting is ignored if a peak is manually linked to a compound in the calibration using the Force Peak Name function in the Chromatogram window. For more details see also chapter Peak This column is hidden by default, For more details see also chapter Setup Columns |
All signals |
| Peak Type |
Specifies the type of the calibrated compound. This column is shared across all signals and defines whether the entry is treated as an individual peak or a group. Individual Peaks Individual peaks represent single compounds identified as a distinct peak in the chromatogram. These types can be switched between each other at any time. The available types are:
Groups Groups represent a collection of peaks that are treated as a single unit. The available types are:
Once a group is created in the Calibration Summary Table, its Peak Type cannot be changed. Additionally, individual peaks (Ordnr or Refer) cannot be converted into groups, and groups cannot be changed into individual peaks. |
All Signals |
| Named Groups | A column for managing Named Groups. If a Named Group is defined, the corresponding row contains an Edit... button, allowing you to modify which compounds belong to it. For individual compounds, this column displays the Named Group they are assigned to. | |
| Is ISTD |
Indicates whether the given compound is an Internal Standard (ISTD) peak and assigns an ISTD peak number. Up to 10 compounds in the calibration file can be marked as internal standards. Groups cannot be assigned as ISTD peaks. This setting is applied only if Calculation is set to ISTD in the Chromatogram window for the evaluated chromatograms. |
All signals |
| Use ISTD |
Specifies which Internal Standard (ISTD) peak is used for the calculation of a given compound. When the first ISTD peak is selected in the Is ISTD column, the Use ISTD column for all other compounds is automatically set to this peak. If a peak is set as ISTD, it cannot Use ISTD peak for calculation. Group (Grp_X) can Use ISTD for calculations. This setting is applied only if Calculation is set to ISTD in the Chromatogram window for the evaluated chromatograms. |
All signals |
| Peak Color | Sets the color used to highlight the peak area in the chromatogram. | All signals |
| Reten. Index |
Used to enter known Retention (Kováts) Indexes for certain compounds. In the evaluated chromatogram, retention indexes for other compounds are then calculated based on the calculation method set in Calibration Options – Log. Interpolation with Unretained Peak, and the specified Unretained Time. For more details, see How to use Kováts Reten. Indexes topic in the User Guide. This column is hidden by default, For more details see also chapter Setup Columns |
All signals |
| LOD |
Limit of Detection (LOD). Used to enter the known Limit of Detection (LOD) for this compound using this method. In the evaluated chromatogram, if the compound is below the detection limit, "< LOD" is displayed in the Peak Type field. | Active signal |
| LOQ |
Limit of Quantification (LOQ). Used to enter the known Limit of Quantification (LOQ) for this compound using this method. In the evaluated chromatogram, if the compound is below the quantification limit, "< LOQ" is displayed in the Peak Type field. | Active signal |
| Response Base |
Defines what should be used as the Response for the given compound. Options are H (Height), A (Area), P (Area Percent). See Quantification section for more details. When a new compound is added, the default value is pre-filled based on the Calibration Options - Defaults tab. |
Active signal |
| Manual Resp. Factor |
Used to enter the factor for calculating results for the compound when the Curve Fit Type is set to Free Calibration. It serves as a simple single-point calibration. If Free Calibration Curve Fit Type and Manual Response Factor is set, the entered Amount value for the compound will not be used. In the evaluated chromatogram, the amount is calculated as the response of the peak multiplied by this coefficient. |
Active signal |
| Correction Factor |
Used to enter a correction factor for Amount, for example, to account for lower recovery. The Amount - whether entered directly, derived from another compound using Calculate By, or calculated from Manual Response Factor based on the response - is multiplied by the Correction Factor to obtain the final Amount. This column is hidden by default, For more details see also chapter Setup Columns |
Active signal |
| Calculate By |
Sets a compound whose Calibration Curve will be used for Amount calculation of a given compound in the evaluated chromatogram. Only compounds already added to the calibration can be selected. Named Groups cannot be selected as the Calculate By parameter. A calibration curve constructed with entered Amount and Response values for the compound, that is set to be Calculated By another one will not be used. Do not use Calculate By in combination with ISTD calculations. For ISTD peaks, Calculate By is ignored. For peaks calculated with ISTD, applying Calculate By may lead to unexpected results. This column is hidden by default, For more details see also chapter Setup Columns |
All signals |
| Curve Fit Type |
Determines the type of the curve used to fit the data. See Quantification section for more details. When a new compound is added, the default value is pre-filled based on the Calibration Options - Defaults tab. This column is hidden by default, For more details see also chapter Setup Columns |
Active signal |
| Origin |
Specifies the method for including origin zero point into the calibration curve. See Quantification section for more details. When a new compound is added, the default value is pre-filled based on the Calibration Options - Defaults tab. When a valid Blank level is added this option is automatically changed to Ignore Origin for given compound. In case of conflicting setting warning is displayed above the table. This column is hidden by default, For more details see also chapter Setup Columns |
Active signal |
| Ending Point |
Specifies the maximum interpolation of Sigmoid and Half Sigmoid Curve Fit Type. See Quantification section for more details. This column is hidden by default, For more details see also chapter Setup Columns |
Active signal |
| Weighting Method |
Determines the value of the weight of individual points when calculating the interposing curve. See Quantification section for more details. When a new compound is added, the default value is pre-filled based on the Calibration Options - Defaults tab. This column is hidden by default, For more details see also chapter Setup Columns |
Active signal |
| Linearization X |
Sets the X-axis linearization for the calibration curve calculation. See Quantification section for more details. When a new compound is added, the default value is pre-filled based on the Calibration Options - Defaults tab. This column is hidden by default, For more details see also chapter Setup Columns |
Active signal |
| Linearization Y |
Sets the Y-axis linearization for the calibration curve calculation. See Quantification section for more details. When a new compound is added, the default value is pre-filled based on the Calibration Options - Defaults tab. This column is hidden by default, For more details see also chapter Setup Columns |
Active signal |
| Level X |
The Level header groups multiple columns related to a specific calibration level. The calibration table consists of 20 standard levels plus a Blank (BL) level. The Blank (BL) level has Amount set to "BLANK" and is treated as a zero-level reference. Each level must be filled separately, and values are displayed according to the level number in the header. In Standard Addition Display Mode (STDADD), the first standard level is transformed into the Unknown level, with Amount set to "UNKNOWN". |
- |
| Response |
Represents the signal intensity used for quantification, based on the selected Response Base. The Response value is read from the standard chromatogram during the (re)calibration process. Manual adjustment of Response is possible unless disabled in Calibration Options. If a compound's response is manually modified at any level that includes at least one recalibration, the entire recalibration history for that calibration point will be cleared. A warning message will appear before proceeding. |
Active signal on active level |
| Amount | Amount of the compound at the selected level, in units specified in Calibration Options dialog. If the Amount or Response of a calibration level (1–20) is 0, the calibration point is not created. | All signals on active level |
| Resp. Fact. | Response coefficient for each level. See Individual Compound Table section for more details. | Active signal on active level |
| Rec No. | Shows number of used recalibrations to number of total recalibrations on the level displayed. See Individual Compound Table section for more details. | Active signal on active level |
| Lin Response |
Displays calculated value of Response; the calculation is based on the option selected in Linearization Y. This column is hidden by default, For more details see also chapter Setup Columns |
Active signal on active level |
| Lin Amount |
Displays calculated value of Amount; the calculation is based on the option selected in Linearization X. This column is hidden by default, For more details see also chapter Setup Columns |
Active signal on active level |
Local menu of the Calibration Summary Table
In addition to the common commands for the majority of tables, the local menu contains the following items:
Delete Compound
Removes the actual substance from the calibration.
Delete All Compounds
Removes all compounds from the calibration (from all calibration levels).
Filter Not Used Compounds
Hides/shows rows (and related tabs) of compounds that have the Used checkbox disabled.
Note:
Warning is displayed above the Calibration Summary Table when rows are hidden. Clicking Show all disables filtering.
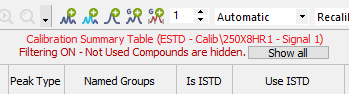
Filtering ON warning
Graph of the calibration standard
This section displays the chromatogram loaded using the File – Open Standard command. Its name is shown above the chromatogram, along with information about the linked calibration file.
The view facilitates the transfer of retention times and responses from the chromatogram to the calibration table. It follows the display settings from User Options, except for the Peak Area Coloring setting, which is ignored.
Peak Color remains visible regardless of display settings if a color is set in the calibration and the calibration is linked to the standard chromatogram. This can also be done directly in this window using the Link Calibration to Standard command.