Graph Properties - MS Spectra tab
Tabs: Graph - Axes Appearance - Time Axis - Signal Axis - Signals - Gradient & Auxiliary Signals - Auxiliary Signal Details
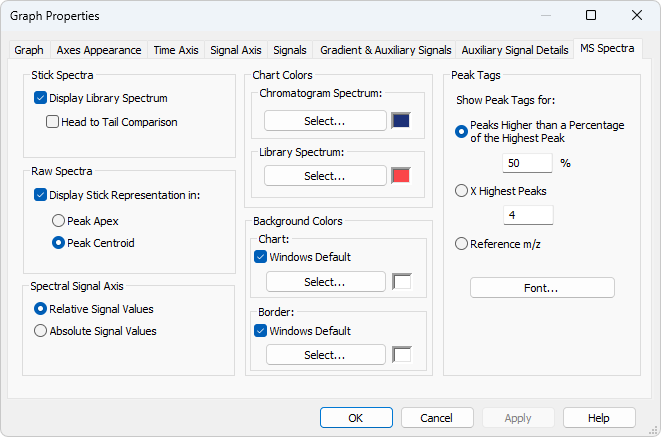
Allows to set the display form of the spectra graph in the MS Extension.
Graph Properties - MS Spectra
Section for setting the appearance of the spectrum graph when it is switched to the Stick Spectrum mode.
Sets the visibility of the library spectrum. This will be only visible for peaks defined in the MS Method Table with the Library Compound selected.
The measured spectrum is shown upwards and the library spectrum downwards on the same m/z axis, so matching peaks form mirror images. If not selected, both spectra will be displayed in overlay.
Section for setting the appearance of the spectrum graph when it is switched to the Raw Spectrum mode.
Display Stick Representation in
Sets the presence/visibility of the stick representations for peaks in the raw spectra. The stick representations may be placed either into Peak Apex or in a Peak Centroid of a detected peak. Which peaks are detected is influenced by settings in the MS Method - Peak Detection dialog.
Section for changing the signal axis display.
- Relative signal values (default), where library spectra are matched with the compound spectrum using the first reference ion as the 100% reference.
- Absolute signal values, where the highest ion in the spectrum is taken as the 100% reference for library spectra.
Sets the coloring of the Chromatogram Spectrum and Library Spectrum. Each color may be defined independently using the appropriate Select… button. The Chromatogram Spectrum coloring will be valid for both stick spectra and raw spectra.
Selects the background color - Chart section - and border color - Border section - of a spectrum graph.
Windows Default - Color will automatically be adopted from the MS Windows appearance scheme. If deselected, the color will be set according to the Select button.
Select… - Color selection button.
Defines the placement and format of peak tags in the spectrum graph. The setting is common to both chromatogram spectrum and library spectrum.
Sets which sticks in the spectrum graph will have peak tags.
- Peaks Higher than a Percentage of the Highest Peak - peak tags will be displayed for any sticks with relative intensity higher than set amount (relative to the highest stick).
- X Highest Peaks - peak tags will be displayed for set amount of highest sticks.
- Reference m/z - peak tags will be displayed for the sticks marked as reference m/z in the MS Method Table.
Font
Allows to set the font for the peak tags in the spectral graph.