Create Spectrum Label
Adds labels and lines to the spectrum graph in the MS Extension.
Appends a text label. Select the command and click on the desired location to open the Text Label dialog. The Text Label dialog may also be invoked by double-clicking on the actual text label to modify it.
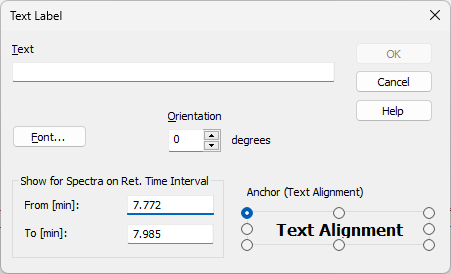
Text Label
The text of the user's label is entered/edited on this line.
Selects the font, size and color of characters. Invoking this command opens the standard Font dialog.
Select the orientation of the label text in degrees counted counterclockwise (e.g. enter 0 for horizontal or 90 for vertical orientation). Allowed values are 0 - 359.
Note:
You can use Orientation field only when using TrueType fonts.
Delete
Deletes the selected label. Appears only when the dialog is opened by double-clicking on the existing label.
Show for Spectra on Ret. Time Interval
Defines the retention time interval in which the label will be visible. Set the retention time span using the From [min] and To [min] fields. The label will be shown if the spectrum is within the defined retention time interval, or if its retention time range overlaps the interval.
Defines the method of label anchoring. One of nine points on the label border or the label center may be selected as the anchor point. The label is then firmly "bound" by that point to the nearest spectrum point (in the m/z, relative intensity coordinates).
A label can be shifted and/or scaled in the same way as in usual drawing applications. Left clicking on a label displays the controlling frame and handles for sizing it. The font size will change with the frame size. To move the frame containing the label, click inside the frame and drag.
Adds connecting lines. To create a line label, invoke the command and then left click and hold the button on the desired starting point of the line, drag to the desired end point and release. The Line Label dialog will open to determine the properties of the line. The dialog can also be called by double-clicking on the actual line label to change its appearance.
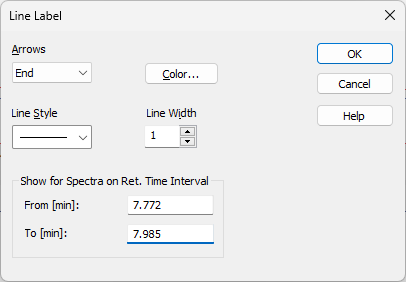
Line Label
Selects optional line end:
None - No arrows will be placed on the line.
Beginning - An arrow will be added to the line beginning.
End - An arrow will be added to the line end.
Both - Both line ends will be provided with arrows.
Color…
Selects the line color.
Defines the line style. If the Line Width parameter is greater than 1, the line will be solid. Possible variants for the Line Style are solid line, broken line, dotted line, dashed and dotted line or dashed and double dotted line.
Defines the line width in pixels (1 to 6). Lines with the width greater than 1 have to be solid.
Delete
Deletes the selected label. Appears only when the dialog is opened by double-clicking on the existing label.
Show for Spectra on Ret. Time Interval
Defines the retention time interval in which the label will be visible. Set the retention time span using the From [min] and To [min] fields. The label will be shown if the spectrum is within the defined retention time interval, or if its retention time range overlaps the interval.
A line can be shifted or sized in the same way as in drawing applications. Left clicking on a line will display the controlling frame and handles the sizing of the line. To shift the line, left click and hold anywhere on the line except the end points, drag to the desired location and release.