MS Search
MS Search dialog is used to set the parameters for search in spectral libraries. The search is performed by NIST MS Search program mechanism on libraries linked to Clarity - either NIST DEMO17 library installed by default, or commercial libraries purchased by the user. The search results (Compound Name (identity), Match, R. Match) returned by NIST MS Search are the same as if the search was performed directly in MS Search with the same parameters. The only exception is the Probability value, which may differ slightly. It is only an approximate, indicative value derived from the current set of fixed-result values.
Clarity can perform three types of search - Single Compound Search, Automatic Compound Search and Target Compound Search.
Single Compound Search tab serves for performing a simple search of a single spectrum in one or more spectral libraries. It is invoked by using the Single Compound Search  command from the MS menu of the MS Chromatogram window.
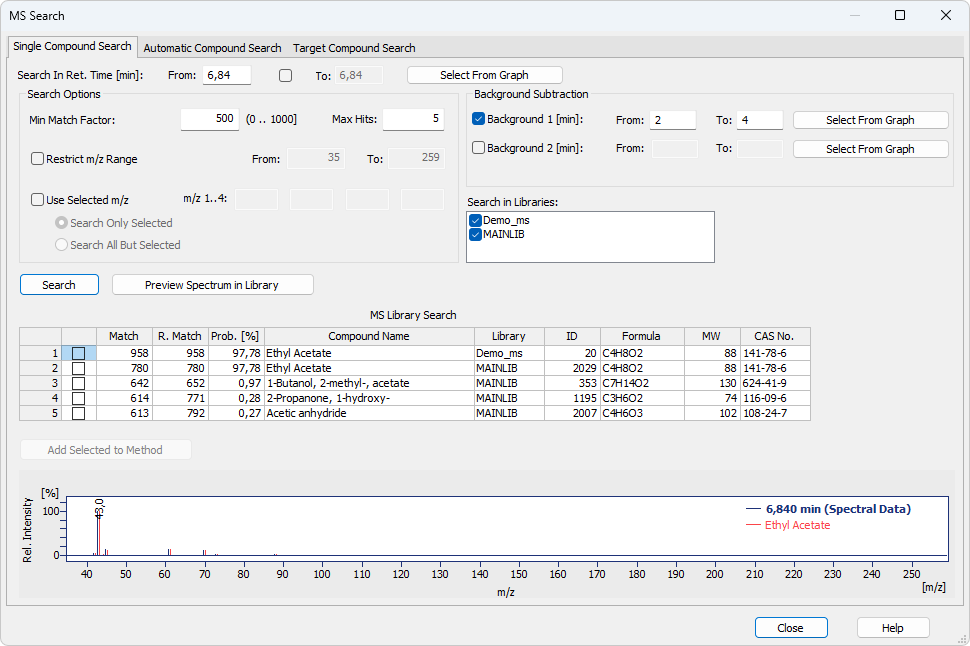
MS Search - Single Compound Search dialog
Either an exact retention time or an interval can be selected to search in. The values can be input manually or by selecting in the graph. The spectrum from the selected retention time will be compared with the spectral libraries and results will be returned based on further setting, i.e. Search Options and Background Subtraction.
When this button is clicked, a mouse cursor will be focused into the graph. A single click selects an exact retention time. Holding the CTRL key, you can select a retention time range by clicking once for the beginning and once for the end of the interval.
Section allowing to set several parameters for the spectral search.
Restricts the hits returned to Clarity from the MS Search program to just those with match factor higher than or equals to the value set in the field. Changing the value in the field only applies when the search is invoked again. Valid numbers are whole numbers from 0 to 1000.
Restricts the number of hits returned to Clarity from the MS Search program. Valid values are whole numbers from 1 to 100. Changing the value in the field only applies when the search is invoked again.
Sets the range of m/z values that will be searched in the library spectra.
- Search Only Selected performs the search using only up to four selected m/z values. Using this option searches the libraries only for spectra containing the selected m/z ions with non-zero intensities, giving best matches to compounds that have the relative intensities of such sticks closest to ones in the chromatogram. When the Restrict m/z Range together with Search Only Selected are set, only those m/z ions belonging to this restricted range are searched.
- Search All But Selected excludes from the search up to four ions selected in the m/z 1..4 fields.
Allows to select the libraries which should be used for the spectral search. It is possible to select multiple libraries.
Up to two background intervals can be selected to be subtracted from the spectrum before the search. Such background intervals can be input either as an exact retention time or as an interval.
When this button is clicked, a mouse cursor will be focused into the graph. A single click selects an exact time for background subtraction. Holding the CTRL key, you can select a time range by clicking once for the beginning and once for the end of the interval.
When invoked, the search in NIST Libraries is performed using the external MS Search program.
Caution:
Parameters changes in the MS Search - Single Compound Search dialog will not be applied for results in the MS Search - Single Compound Search dialog until the Search or Preview Spectrum in Library button is pressed once again.
When invoked, the selected spectrum will be shown in NIST Libraries using the external MS Search program. More parameters can be set in the MS Search program (menu Options - Library Search Options - Libraries tab).
Caution:
Parameters changes in the MS Search - Single Compound Search dialog will not be applied in the search options in the MS Search program, manual search performed there may thus yield different results. To change parameters used for the search in MS Search program, Options - Library Search Options command must be used and changes must be done in the Library Search Options dialog (on various tabs).
Adds the checked rows from MS Library Search into the MS Method table.
This table contains the results of the search from the MS Search program. The table contains the Match, Reverse Match, Probability, Compound Name, Library, ID, Formula, MW and CAS No. columns, as used in the MS Search program.
The graph displays the overlay of the chromatogram signal (as defined in the Search In Ret. Time field for the library search) and the library spectrum of a compound selected in the MS Library Search table. Standard operations (zooming, etc.) are allowed in the graph, it's format (mainly peak tag format, overlay/head-to-tail mode, spectra colors) is dependent on the settings on the Graph Properties - MS Spectra tab. It is possible to open the tab using the context menu invoked by right-click in the graph area.
Automatic Compound Search tab serves for performing an initial search on a chromatogram where the user knows what he can expect. It is possible to quickly fill the whole MS Method table by running an Automatic Compound Search. The function is invoked by using the Automatic Compound Search  command from the MS menu of the MS Chromatogram window.
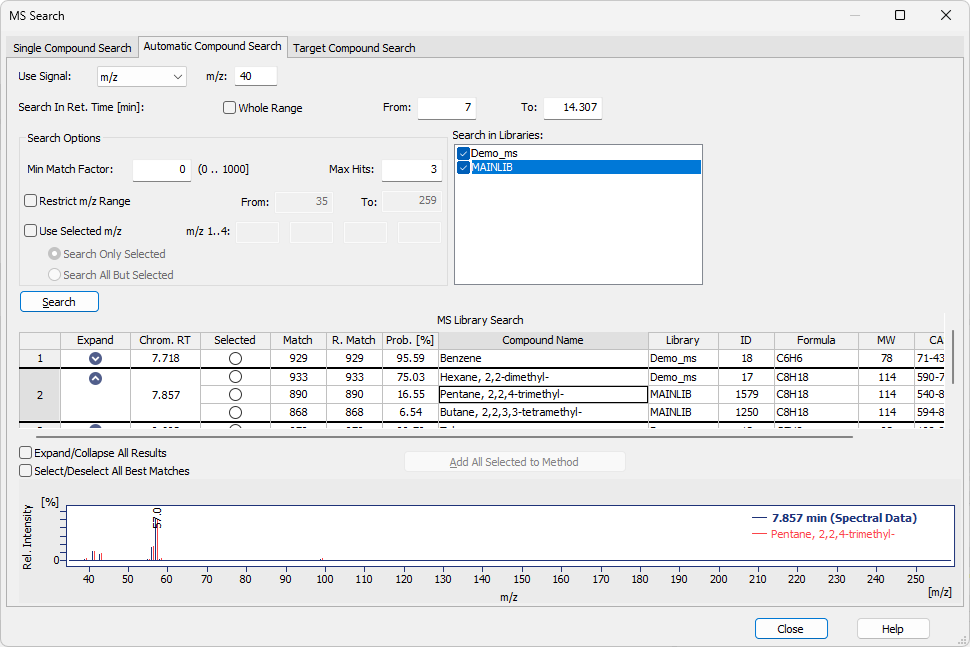
MS Search - Automatic Compound Search dialog
Sets the signal on which the peaks will be detected and their spectra will be matched with spectral libraries. It is possible to select any standard signal including TIC, as well as external signals and signals extracted from the raw data (in such case you have to select the desired m/z in the appropriate field). While adding found compounds to MS Method, the signal set in this combo box will be propagated to Quantify On column in MS Method table.
By default, the search interval covers the entire range of the chromatogram where the spectral data are available - typically, this means the whole chromatogram. If needed, search interval can be specified in the from and to edit boxes, enabled after unchecking the check box Whole Range. The spectrum from the selected retention time will be compared with the spectral libraries and results will be returned based on further setting, i.e. Search Options.
Section allowing to set several parameters for the spectral search.
Restricts the hits returned to Clarity from MS Search program to just those with match factor higher than or equals to the value set in the field. Valid numbers are whole numbers from 0 to 1000.
Limits the number of hits returned to Clarity from MS Search program for each compound. Only the best match is shown, remaining results for each peak can be shown by clicking on the chevron in Expand column or by clicking on Expand/Collapse All Results check box. Only one compound per each peak can be selected.
Sets the range of m/z values that will be searched in the library spectra.
- Search Only Selected performs the search using only up to four selected m/z values. Using this option searches the libraries only for spectra containing the selected m/z ions with non-zero intensities, giving best matches to compounds that have the relative intensities of such sticks closest to ones in the chromatogram. When the Restrict m/z Range together with Search Only Selected are set, only those m/z ions belonging to this restricted range are searched.
- Search All But Selected excludes from the search up to four ions selected in the m/z 1..4 fields.
Allows to select the libraries which should be used for the automatic search. It is possible to select multiple libraries.
Search
When invoked, the search is started and results are displayed in the MS Library Search table.
Note:
In larger libraries and on slower computers, the search may take several minutes to complete. A progress dialog is displayed during it's course.
MS Library Search table
This table shows the search results in the following columns:
- Expand - Allows you to view additional results for each compound. Click the chevron in this column or use the Expand/Collapse All Results checkbox to show or hide all results at once.
- Chrom. RT - Retention time of the compound in the chromatogram.
- Selected - Marks the library match to be added to the MS Method. You can select the best hit directly or expand the list to view and change other matches.
- Match, Reverse Match, Probability % - Numerical indicators of the similarity between the acquired and library spectra.
- Compound Name, Library, ID, Formula, MW and CAS No. - Identification and source information for the matched compound.
By default, the table lists the number of best matches for each peak up to the value specified in Max Hits. If fewer results that otherwise match the search criteria (e.g. have Min Match Factor higher than set value) are available, only those are displayed.
Only one search result per peak can be selected.
Transfers the selected compounds from the MS Library Search table to the MS Method table, including their compound names and retention times. These values can be modified later in the MS Method table.
Spectrum graph
The graph displays the overlay of the chromatogram signal as set in the Search In Ret. Time field used for the library search and the library spectrum of a compound selected in the MS Library Search table. Standard operations (zooming, etc.) are allowed in the graph, it's format (mainly peak tag format, overlay/head-to-tail mode, spectra colors) is dependent on the settings on the Graph Properties - MS Spectra tab. It is possible to open the tab using the context menu invoked by right-click in the graph area.
Target Compound Search tab is used to locate the position or presence of the desired compound in the chromatogram. It is possible to quickly browse the spectra across the whole chromatogram and find the one that best matches the spectrum of the target compound. The function is invoked by using the Target Compound Search  command from the MS menu of the MS Chromatogram window.
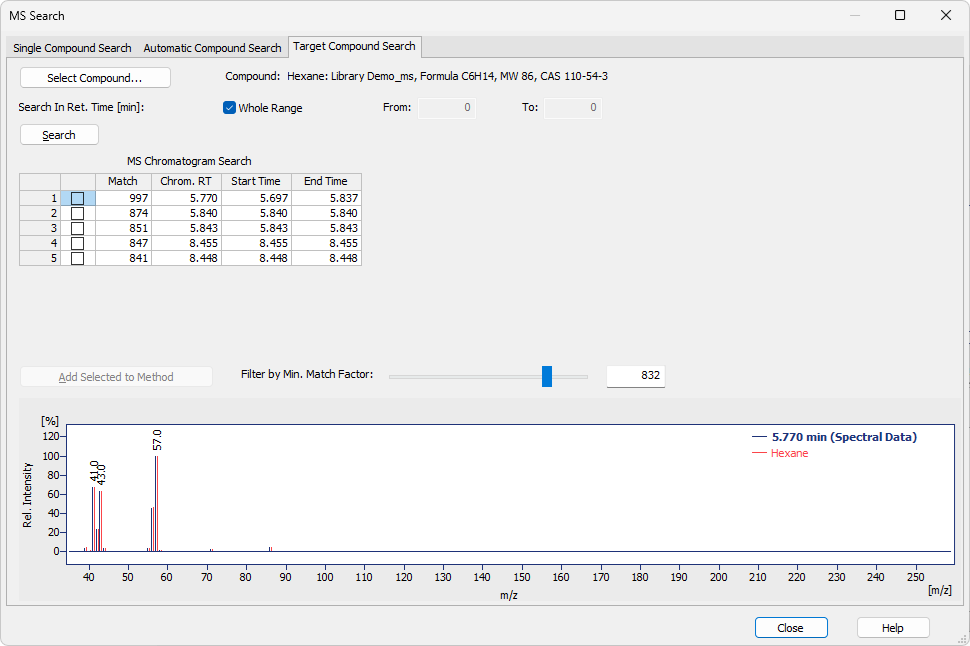
MS Search - Target Compound Search dialog
Opens the Select NIST Compound dialog for selecting the desired compound.
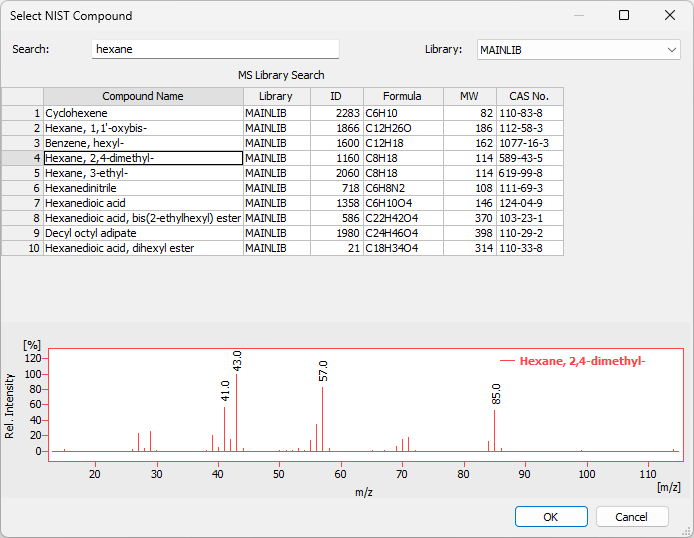
Select NIST Compound dialog
Select the library from the Library drop-down menu and enter the compound name in the Search field. The table below the field will restrict the available compounds in real time. Select the desired compound in the table and press the OK to return to MS Search - Target Compound Search dialog, where the selected compound is displayed in the Compound field.
By default, the search interval is the whole range where spectral data are defined. If needed, such search interval can be specified in the from and to edit boxes, enabled after unchecking the check box Whole Range.
Search
When invoked, the search is started and the results are shown in the MS Chromatogram Search table.
This table shows the search results in the following columns: Chrom. RT, Match, Start Time and End Time. The result can be filtered using the Filter by Min. Match Factor slider.
Add Selected to Method
Adds the checked rows from MS Library Search in the MS Method table. The Retention Time of the compounds in the MS Method table will be set to the times shown in the Chrom. RT field in the MS Chromatogram Search table.
Use the slider (or enter the value in the box next to it) to set the minimum Match factor for intervals displayed in the MS Chromatogram Search table.
- Move right: increases the minimum required Match Factor. This may split or narrow intervals and eventually hide them if the value exceeds the best match.
- Move left: decreases the minimum required Match Factor, which widens existing intervals or adds new ones with lower-quality matches.
The slider should be set so that the displayed interval is representative for the compound before pressing Add Selected to Method.
Spectrum graph
The graph displays the overlay of the chromatogram signal as set in the Search In Ret. Time field used for the library search and the library spectrum of a compound selected in the MS Library Search table. Standard operations (zooming, etc.) are allowed in the graph, it's format (mainly peak tag format, overlay/head-to-tail mode, spectra colors) is dependent on the settings on the Graph Properties - MS Spectra tab. It is possible to open the tab using the context menu invoked by right-click in the graph area.