Integration
Invoking this command switches the results panel to the Integration tab. This tab contains:
- Integration Algorithm selector – applies to all signals in the chromatogram.
- Integration Table – specific to the currently active signal.
The table header shows the signal name and uses its color for easy identification.
The settings come from the Integration tab of the method used for acquisition. You can modify them using tools from the Chromatogram toolbar or menu.
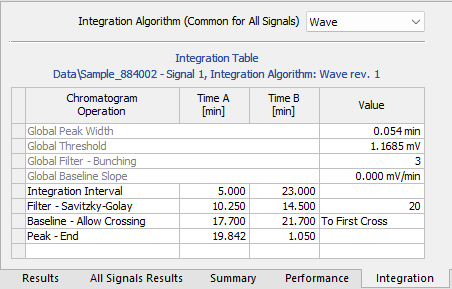
Selects the algorithm used to integrate the chromatogram. Applies to all signals.
- Two available algorithm lines: Wave and Legacy.
- Each has a different approach to automated integration.
- Some features are only available in the Wave algorithm.
If the selected algorithm fails to integrate the chromatogram properly, try switching to the other one.
Default behavior:
- New methods use Legacy by default.
- Newly measured chromatograms use the algorithm defined in the method.
Historical versions:
When opening a chromatogram with a saved method that used an older algorithm version, the dropdown shows:
- Latest Legacy
- Latest Wave
- Historical version used during acquisition
Each version includes its revision number for clarity. Once the chromatogram is edited, the algorithm updates to the latest version of its line and cannot be reverted.
Integration table
Lists all operations applied to baseline and peaks.
Header includes the chromatogram name, signal name, and integration algorithm version. This information is also printed when the table is printed.
Defines the operation to apply. Use the dropdown (click right edge) to access a list of all available operations.
The Integration Table always includes the following global integration parameters:
- Global Peak Width
- Global Threshold
- Global Filter – Bunching
- Global Baseline Slope (Wave IA only)
These rows are always present, cannot be deleted, and are pre-filled with default values unless changed by the user. More details on these parameters can be found in the Chromatogram topic.
Users can add other types of integration operations to the table as needed. The full list of available operations is described in the help topics: Integration, Baseline, Peak, Separation, Noise & Drift.
Chromatogram - Integration tab
Interval start or peak retention time.
Interval end or new position (relative to peak apex). 0 means end of chromatogram.
Operation-specific value (with units).
Using relative time operations helps match peaks across chromatograms with small retention time differences.
Integration Process
This section describes the order in which integration operations are applied:
- Filters
- Global/Local Peak Width, Threshold, Integration Interval, Detect Negative
- ValleyToValley Slope, Tangent Area Ratio, and Tangent Slope Ratio
- Remaining operations in the Integration Table (apart from those listed below)
- Rejection operations (e.g., Baseline Lock)
- Operations that do not affect integration (e.g., Groups, Force Peak Name)
Paste (CTRL+V) into the Integration Table
You can paste into the table, but with limitations:
- Only full, non-global rows can be pasted.
- You cannot overwrite only particular lines or just selected values.
- You can edit individual cells manually.
- Pasting is validated for correct format – errors are shown if validation fails.
Common issues:
- Too few columns
- Global operations
- Units pasted inside value fields (e.g. from Excel or text file)
For easier management, consider using the Set Model, Copy from Model, or Copy from Chromatogram commands (described in the section Method).