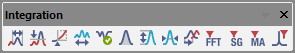
Integration
Menu for adjustment of integration parameters. All commands can also be invoked using icons from the Integration toolbar.
All integration parameters are executed as a part of the Integration Table (for more details see also chapter Integration)
Note:
For all integration commands, both the parameter values and their intervals can be edited later in the Integration Table.
All interval operation follows the rule that with Time B = 0 operation will be applied from Time A to the end of the chromatogram. With both Time A and Time B set to 0, operation is applied over the whole chromatogram.
Integration commands in Baseline bar

|
Local Peak Width | Defines minimum width of peak. |

|
Local Threshold | Describes the threshold of noise. |

|
Local Baseline Slope | Defines the position of automatically found peak starts and peak ends. The command is only available if Wave Integration Algorithm is used. |

|
Integration Interval | Sets the interval for the integration algorithm. |

|
Detect Negative | Detects negative peaks. |

|
Minimal Area | Sets the minimum peak area. |

|
Minimal Height | Sets the minimum peak height. |

|
Minimal Half Width | Sets the minimum peak width in half-height of the peak. |

|
Detector Delay | Shifts the signal on the time axis. |

|
FFT Filter | Applies/suspends the FFT Filter (Fast Fourier Transformation) for noise reduction. |

|
Savitzky-Golay Filter | Applies/suspends the Savitzky-Golay Filter for noise reduction. |

|
Moving Average Filter | Applies/suspends the Moving Average Filter for noise reduction. |

|
Spike Filter | Applies a filter that removes spikes to the selected region of the chromatogram. Only available in Clarity version 4.0 or higher. |
 Local Peak Width
The Local Peak Width command is a local variant of the Global Peak Width. It allows you to set a different minimum peak width within a defined interval of the chromatogram, while the rest of the chromatogram remains controlled by the global setting (for more details see also chapter Chromatogram)
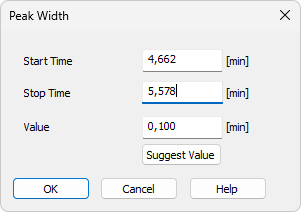
Using theLocal Peak Width command or pressing the Local Peak Width icon opens the Peak Width dialog where set the interval and enter the required Peak Width value. Peak Width parameter should match the narrowest peak of interest.
Peak Width
How to set Local Peak Width:
- Use the Local Peak Width command or press the Local Peak Width icon .
- You will be prompted to mark the interval where the Local Peak Width parameter will be applied by placing the cursor at its beginning and end and confirming each with a left-click.
- Then the Peak Width dialog opens, where you can adjust the Start Time and Stop Time fields and enter the required peak width in the Value field.
- To determine the value automatically, click Suggest Value, then mark the narrowest peak that still has to be integrated. The suggested value is transferred to the Value field.
- Click OK to apply the selected value to the specified interval.
Specifies the beginning of the interval.
Specifies the end of the interval.
Defines the Local Peak Width parameter for the selected interval. The value can also be suggested by Clarity using the Suggest Value button.
Displays the cursor lines again and prompts you to select the narrowest peak that must still be integrated. The suggested value is transferred to the Value field, where it can be confirmed or adjusted.
Local Threshold
The Local Threshold command is a local variant of the Global Threshold. It allows you to set a different noise threshold within a defined interval of the chromatogram, while the rest of the chromatogram remains controlled by the global setting (for more details see also chapter Chromatogram)
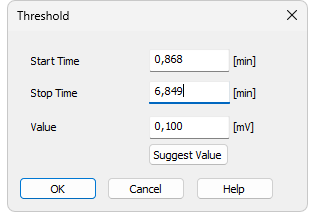
Using the Local Threshold command or pressing the Local Threshold icon opens the Threshold dialog, where you can set the noise threshold for peak integration in the selected interval. The Threshold parameter determines the sensitivity of the integration algorithm to distinguish peaks from noise. In the Wave integration algorithm, the Threshold also defines the positions of peak starts and ends, unless this is overridden by the Slope parameter.
The height of all peaks to be detected (measured from the baseline to the apex) must be at least twice the Threshold value.
Threshold
How to set Local Threshold:
- Use the Local Threshold command or press the Local Threshold icon .
- You will be prompted to mark the interval where the Local Threshold will be applied by placing the cursor at its beginning and end and confirming each with a left-click.
- Then the Threshold dialog opens, where you can adjust the Start Time and Stop Time fields and enter the required threshold in the Value field.
- To determine the value automatically, click Suggest Value, then mark the area with the “highest peaks” that still should not be integrated. The suggested value is transferred to the Value field.
- Click OK to apply the selected value to the specified interval.
Note:
In the Wave integration algorithm, peaks smaller than twice the threshold may still appear in the chromatogram if they share the baseline with valid higher peaks, so as not to influence the course of the baseline. Such peaks can be hidden using the Peak - Hide function or removed by adjusting the baseline with the Integration - Minimal Height operation set to twice the threshold value.
Specifies the beginning of the interval.
Specifies the end of the interval.
Defines theLocal Threshold parameter for the selected interval. The value can be suggested by Clarity using the Suggest Value button.
Displays the cursor lines again and prompts you to select the “highest peaks” that still should not be integrated. The suggested value is transferred to the Value field, where it can be confirmed or adjusted.
Local Baseline Slope
The Local Baseline Slope command is available only when the Wave integration algorithm is used.
It is a local variant of the Global Baseline Slope and allows you to define a different slope within a selected interval of the chromatogram. By setting this slope, you determine where peaks start and end in that interval, while the rest of the chromatogram remains controlled by the global setting (for more details see also chapter Chromatogram)
If the Local Baseline Slope is not defined (value set to 0), the peak start and end positions are derived from the Threshold parameter (8 * Threshold at the given chromatogram area), which is the same principle used in the Legacy integration algorithm.
Slope
How to set Local Baseline Slope:
- Use the Local Baseline Slope command or press the Local Baseline Slope icon .
- You will be prompted to mark the interval where the parameter will be applied by placing the cursor at its beginning and end and confirming each with a left-click.
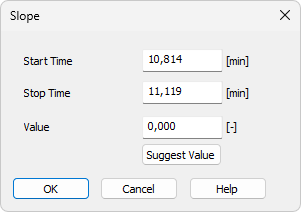
- Then the Slope dialog opens, where you can adjust the Start Time and Stop Time fields and enter the required slope in the Value field.
- To determine the value automatically, click Suggest Value, then mark the position of the expected peak start or peak end. The suggested value is transferred to the Value field.
- Click OK to apply the selected value to the specified interval.
Note:
The suggested value corresponds to the slope calculated at the selected position. However, the actual placement of the peak start or end may differ slightly, because the expected slope is checked along the entire signal curve and other areas closer to the peak apex may also fulfill the slope condition.
Specifies the beginning of the interval.
Specifies theend of the interval.
Defines the Local Baseline Slope parameter for the selected interval. The value can also be suggested by Clarity using the Suggest Value button.
Displays the cursor line again and prompts you to select the position where the expected peak start or end should be placed automatically by the integration algorithm. The suggested Slope value will be transferred to the Value field, where it can be confirmed or adjusted.
Integration Interval
Invoking this command or using the Integration Interval icon allows to define the interval in which the integration algorithm is run. The course of the chromatogram outside of this interval will be ignored.
After using the function you are prompted to select the beginning and end point of the interval in the graph using the mouse. The starting time or ending time of the interval may be adjusted or directly set in the Integration Table on the Integration tab. When the Integration Interval command is not used, the integration algorithm is run on the whole chromatogram.
Caution:
It is not true that the Integration Interval command is an opposite to the Baseline - Lock command. Although their logic is opposite (the first command will permit the integration in the interval and in the second will prohibit it) there is a significant difference between using the Integration Interval command (which directly defines where the integration algorithm will be used) and using the Baseline - Lock command (which only prohibits already integrated peaks). In other words: the Baseline - Lock command does not radically change the course of the baseline before and beyond the area with suppressed peaks.
Detect Negative
Invoking this command or using the Detect Negative icon enables the detection of negative peaks in the defined interval. When the function is not active on the given part of the chromatogram, all negative peaks present are considered to be the correct course of the baseline (similar to the part of the chromatogram which uses the Reject Negative function).
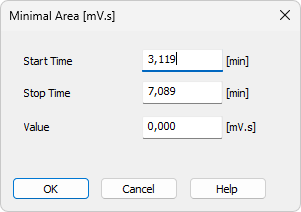
Minimal Area
Invoking this command or using the Minimal Area icon allows you to set minimum allowed area of the peak. Peaks with areas smaller than or equal to this value are excluded from the integration.
Minimal Area
Enables to edit the interactively set Start Time of the interval. The value set in the Value field will be applied within this interval only.
Enables to edit the interactively set Stop Time of the interval. The value set in the Value field will be applied within this interval only.
Enables to edit the suggested value of the Minimal Area parameter.
Minimal Height
Invoking this command or using the Minimal Height icon allows to set the minimum height of the peak. Peaks with heights smaller than or equal to this value are excluded from the integration. Parameters and fields in the Minimal Height dialog are the same as in the Minimal Area dialog.
Minimal Half Width
Invoking this command or using the Minimal Half Width icon allows to set the minimum half-width of the peak. Peaks with W05 parameter smaller than or equal to this value are excluded from the integration. Parameters and fields in the Minimal Half Width dialog are the same as in the Minimal Area dialog.
Detector Delay
Invoking this command or using the Detector Delay icon allows to correct the time delay of a detector. You are advised to point and click the cursor on the desired peak of the active signal and then on a corresponding peak in the reference signal.
FFT Filter
Invoking this command or using the FFT Filter icon allows to apply the FFT Filter (Fast Fourier Transformation) for noise reduction in the selected interval. If more than one type of the filter is set on the same time interval, only the last used filter on that interval is actually used. FFT Filter in Clarity is non-parametric and may create artifacts on the signal under certain conditions.
For the description of equations behind FFT Filter calculation please check publicly available resources (Wikipedia).
Savitzky-Golay Filter
Invoking this command or using the Savitzky-Golay Filter icon allows to apply the Savitzky-Golay Filter for noise reduction in the selected interval. If more than one type of the filter is set on the same time interval, only the last used filter on that interval is actually used. Savitzky-Golay Filter in Clarity is parametric, ranging the parameter from 1 (no filter applied) to 500 (filter window is 500 points wide). The parameter for the filter may be changed in the Integration table for the given signal, found on the Integration tab in Chromatogram window. Savitzky-Golay filter may create artifacts on the signal under certain conditions.
For the description of equations behind Savitzky-Golay Filter calculation please check publicly available resources (Wikipedia).
Moving Average Filter
Invoking this command or using the Moving Average Filter icon allows to apply the Moving Average Filter for noise reduction in the selected interval. If more than one type of the filter is set on the same time interval, only the last used filter on that interval is actually used. Moving Average Filter in Clarity is parametric, ranging the parameter from 1 (averaging actual point with the previous and next one) to 500 (filter window is 1001 points wide - 500 points to each side). The parameter for the filter may be changed in the Integration table for the given signal, found on the Integration tab in Chromatogram window. The equation to calculate the moving average filter used in Clarity is:
, where Ei is original signal of point i and p is the parameter entered in the Integration table.
Spike Filter
Invoking this command or using the Spike Filter icon allows to remove the spikes on the chromatogram signal. The parameter of the command (that can be edited from the Integration table) describes how wide spikes will be removed (their missing points replaced by a calculated value). The usage of this function only available in Clarity version 4.0 and higher may be disabled by the use of the Disallow Spike Filter and Spike Removal parameter from the GLP Options dialog (for more details see also chapter GLP Options). Spike Filter in Clarity is parametric, ranging the parameter from 1 (no filter applied) to 100 (filters out spikes 100 points wide maximum). The parameter for the filter may be changed in the Integration table for the given signal, found on the Integration tab in Chromatogram window.