Noise & Drift
The Noise (all variants) and Drift parameters are set as intervals. All values can be utilized in custom calculations in User Columns.
All interval operation follows the rule that with Time B = 0 operation will be applied from Time A to the end of the chromatogram. With both Time A and Time B set to 0, operation is applied over the whole chromatogram.
Noise & Drift above the Result table
The noise evaluation determines the amount of noise in the specified interval of the chromatogram. The interval for any type of noise evaluation is set in the Integration Table.
After invoking the particular Noise Evaluation command, select part of the chromatogram that contains noise only (ideally part of the baseline). In case several intervals for the same noise calculation method are set, only the last one is valid. Previous entries can be filtered from the Integration Table, so that only the last entry will be displayed. Set the interval to zero to display the noise over the whole length of the chromatogram.
If the interval exceeds the length of the actual chromatogram, only the valid part of the interval will be taken into account.
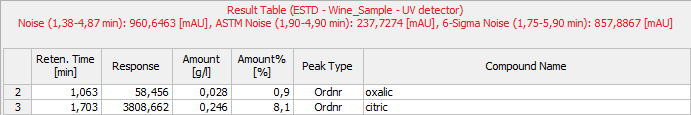
The noise value will be displayed above the Result Table along with appropriate signal units and the interval, from which it was calculated.
Note:
It is possible to calculate the noise using all three methods - linear interlining (Noise Evaluation), ASTM Noise Evaluation and 6-Sigma Noise Evaluation at the same time.
Current noise during acquisition can also be displayed in the upper left corner of the graph in the Data Acquisition window.
Note:
The Noise in the Data Acquisition window is calculated using the cubic interlining to reduce the influence of the trend to its values.
Noise Evaluation
The Noise value for the Noise Evaluation command is calculated using the linear interlining on the interval defined in the Integration Table. If there is a peak in this interval, it will influence the noise values.
ASTM Noise Evaluation
The Noise value for the ASTM Noise Evaluation command is calculated as an average from values counted for smaller intervals. The procedure goes as follows:
- The selected time interval is divided into parts of the same length (30s by default, may be changed in the Integration Table, Value column). The remaining part is added to the last complete interval or left on its own, if it is the only interval.
- Noise is counted for each of these intervals using the linear interlining and the least squares method.
- The values gained from these intervals are then averaged.
6-Sigma Noise Evaluation
The Noise value for the 6-Sigma Noise Evaluation command is calculated from the whole interval set in the Integration Table. The value gained is calculated as a six times the square root of least square method for each point in the whole interval divided by the number of points:
where n is the number of acquisition points, Ei is the signal value of the i-th point and f(Ei) is the value corresponding to the linear regression performed on the selected interval at the i-th point.
Drift Evaluation
The drift evaluation determines the drift between the beginning and the end point of the specified interval, which is set in the Integration Table.
After invoking the Drift Evaluation command, select part of the chromatogram where the Drift should be calculated. If more then one interval has been set, the latest one will be applied. Previous entries can be filtered from the Integration Table, so that only the last entry will be displayed. Set the interval to zero to get the drift over the whole length of the chromatogram.
If the interval exceeds the length of the actual chromatogram, only the valid part of the interval will be taken into account.