LC Gradient Test – Procedure and Evaluation
The LC gradient test is used to verify correct solvent mixing and proper operation of the LC pump.
It does not generate typical chromatographic peaks or compound separation. However, the acquired signal can be evaluated in Clarity using standard chromatogram processing and comparison tools. This evaluation provides a direct measure of gradient accuracy and overall pump performance.
During the test, the solvent ratios programmed in the method are compared with the actual solvent composition delivered by the system. The actual solvent composition is calculated from the detector response and evaluated against a reference measurement. This reference measurement is performed at the same flow rate using a single solvent containing a low concentration of a marker compound that increases the detector response. This reference enables quantitative assessment of gradient accuracy.
In low-pressure gradient systems, the test mainly checks the correct function of the proportional mixing valve and its ability to combine solvent channels in the specified ratios. In high-pressure gradient systems, the test focuses on the accuracy and synchronization of individual pump channels delivering the mobile phases. In both cases, the results also reflect the performance of the mixing chamber and other components responsible for solvent homogenization.
Integration Events Setup
Integration events and commands are described in detail in the Clarity Chromatogram section of the Reference Guide.
- Open the measured chromatogram that contains the gradient test record. The signal does not have the shape of a classical chromatogram with peaks; instead it shows step-like changes corresponding to the programmed solvent composition.
- Switch to the Integration tab in the Chromatogram window.
- Increase the Global Threshold value, if necessary, so that the entire gradient test record is integrated as a single peak (see the Integration Table example below).
- Use Chromatogram - Baseline – Together
 and use the vertical lines to roughly select the entire measured chromatogram.
 - Use the Chromatogram - Add Positive
 command (or use the corresponding icon in the left-hand panel of the Chromatogram window).
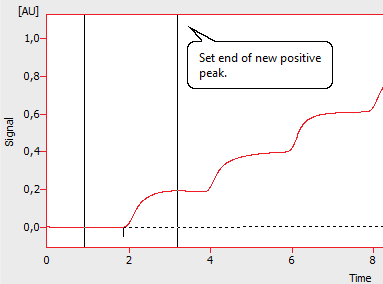
 - Click before the start of the gradient test signal, where only the baseline is present, and then click approximately in the middle of the plateau where the signal is constant.
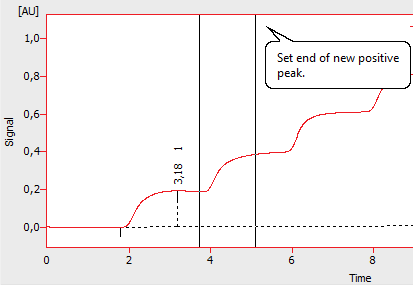
- Select Add Positive again. With the first click, mark the position on the previously selected constant section just before the signal increases to the next solvent ratio. With the second click, mark approximately the middle of the next step (plateau), corresponding to the next gradient ratio.
- Repeat the previous step (7) for all remaining gradient levels. At the end, the number of Add Positive events should match the number of gradient levels in the recorded signal.
- Mark the second half of the last gradient level as a Solvent Peak (the information about its height has already been obtained from the previous peak).
In the left-hand panel of the Chromatogram window, select Solvent Peak and apply it to this section. The Integration Table should match the example shown bellow.
 - Go to the Results tab and verify that the Result Table contains same number of rows as the number of gradient levels in the chromatogram (mixing ratios defined in the method).
Note:
It is recommended to use the Legacy integration algorithm in this case, but if you want to use Wave, don’t forget to also set the Global baseline slope to a higher value so that the entire test is treated as a single peak.
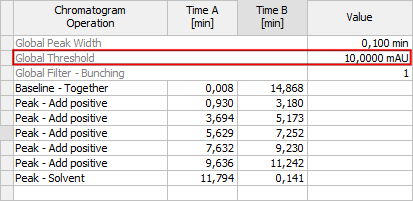
The resulting Integration Table and highlighted Treshhold value
Calibration Setup
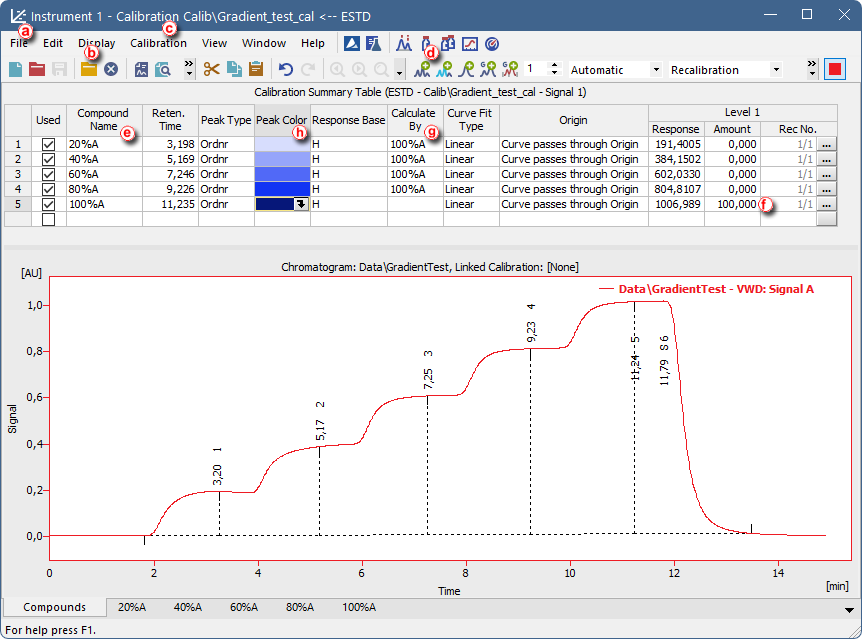
The figure illustrates the individual steps described in the procedure below.
- Open the Calibration window, select File – New ⓐ to create a new calibration.
- Click Open Standard…
 ⓑ and select the integrated chromatogram from the previous section.
 - Open calibration settings: using the Calibration - Options... menu. Compared to the default settings, adjust the following parameters (see the figure below):
- Change Compound Units from mg to %.
- Set Response Base to Height.
- In the upper part of the Calibration window, select Add All
 ⓓ. The Calibration table will be populated with compounds, including the last solvent peak, which is not required. Right-click this compound and select Delete Compound. Again, the number of compounds should match the number of gradient levels.
 - Change the compound names so that they describe the defined solvent mixing ratios ⓔ.
- In the Amount column, assign the value 100 ⓕ to the last compound (highest gradient level), which corresponds to 100% of a single solvent without mixing.
- Display the Calculate By column in the Calibration table and select the appropriate option for each mixing ratio.
- Right-click the table header and select Setup Columns….
- In the Hidden Columns list, select Calculate By and click Show.
- Close the dialog by clicking OK.
- In the Calculate By column, for all compounds/mixing ratios except the last one (100%), select the last compound/mixing ratio 100% ⓖ.
- If desired, you can highlight the individual gradient levels using different color shades in the Peak Color column ⓗ.
- Save the calibration. The resulting calibration should match the example shown in the figure above.
Note:
If you want to use the calibration repeatedly and as a template for future gradient tests, also set Mode to Recalibrate and Recalibration to Replace.
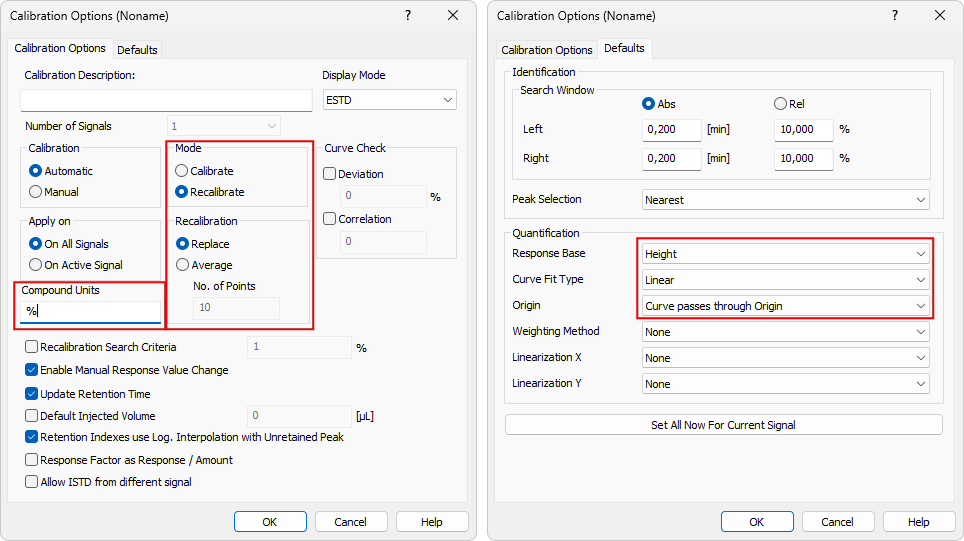
Correct calibration settings
Results Evaluation
- Return to the Chromatogram window and assign this calibration to the measured gradient test chromatogram. On the Results tab, click Set... ① next to Calibration File - [None] and select the calibration created in the previous section and click Open.
- Adjust the columns displayed in the Result Table so that the relevant information is visible, for example as shown in the following figure. The Amount column is the most important for evaluating the gradient test. The resulting chromatogram and Result Table should appear as shown below. The Amount value for the last gradient level should be exactly 100 % ②.
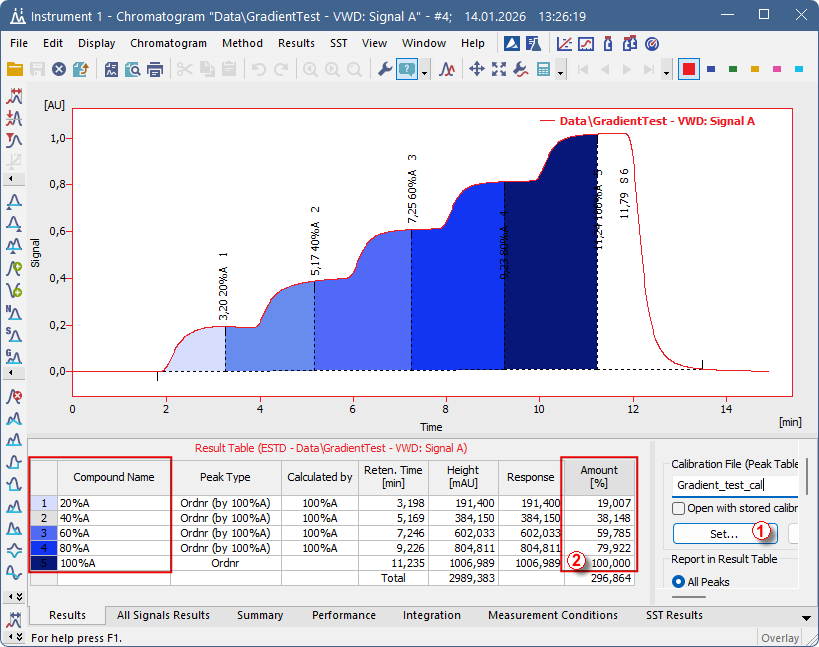
Resulting evaluated Gradient Test
Note:
The result of the gradient test is the difference between the calculated percentages in the Amount [%] column and the values defined in the method controlling the gradient pump.
Processing Subsequent Measurements
- Open the chromatogram with gradient test record you want to finish and use Method - Copy from Chromatogram and choose the chromatogram which has already been finished.
- On the Results tab, click View to open the calibration.
- Go to File in the menu and select Save As..., then save the calibration under a new name and make sure that Recalibrate and Replace options are set.
- In the opened Calibration window, click Add Existing
 at the top of the window and save the calibration.
 - Return to the Chromatogram window and assign this newly created calibration to the chromatogram by clicking Set and selecting the calibration. The Amount value for the last gradient level should be exactly 100 %.
- Save the chromatogram.
- To process and evaluate additional gradient test chromatograms, repeat the procedure starting from step two of this chapter for each chromatogram.