Chromatogram window
Analysis Procedure: Step 1 -> Step 2 -> Step 3 -> Step 4
- The Chromatogram window can be opened also manually by clicking on the Chromatogram
 icon in the Instrument window.
 - Here you can evaluate your previously acquired data or open our sample chromatogram to get familiar with the basic functions which will be covered in this chapter.
- Use the File - Open Chromatogram... command or click the open icon
 and select the Wine_Sample.prm file and press the OK button.
 - The Chromatogram window is divided into two parts: the Graph (upper) pane and the Results (lower) pane.
- Zoom in any part of the chromatogram by selecting the area while holding the left mouse button. Restore the default chromatogram view by double-clicking in the graph.
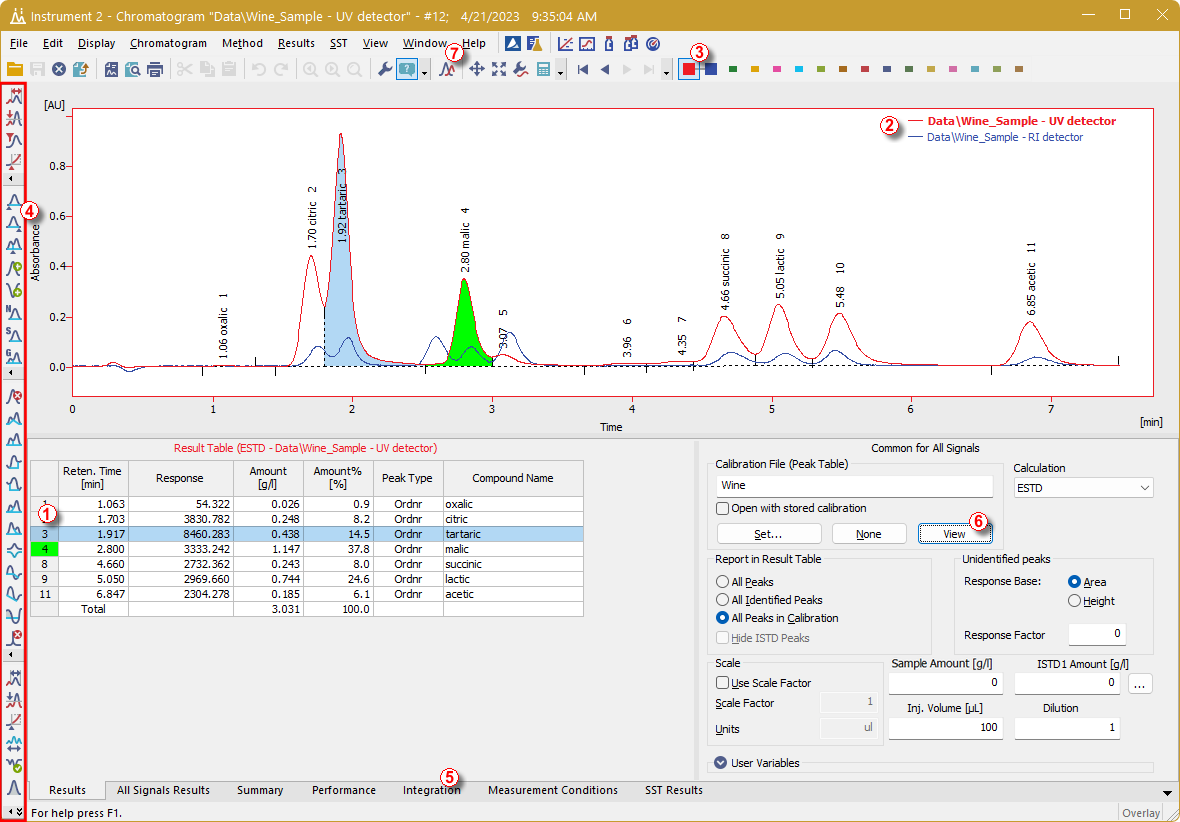
- Clicking on a cell in the Result table ① will highlight the peak (or peaks when selecting multiple cells) corresponding to the row(s) you just selected.
- Only one detector signal can be active at a time. The active signal can be identified in three ways:
- in the legend section at the upper right corner of the graph ②, where the active signal is displayed in bold text
- in the Overlaytoolbar ③, where it is marked with a debossed icon

- by noting the color of the graph outline and table headers.
- Try to change the active signal by double clicking on its name in the legend section. You will notice that the Result table has changed.
- To change the color of the active signal click on the desired color in the Overlay toolbar.
- You can change the integration of peaks using the interactive icons on the toolbar on the left side of the Chromatogram window ④ , selecting the Integration operation in the Chromatogram menu, or directly in the Integration tab ⑤. Any changes made either way will change the Integration table and can be copied to the template method.
- By clicking the View button ⑥ , you can open the calibration linked to this chromatogram.
- To display more than one chromatogram you can enable the Overlay mode ⑦.
Note:
Already measured chromatograms can be reprocessed in the Batch dialog using the newly created method to apply the adjusted Integration table.