Properties…
Sets the characteristics of the Data Acquisition window display. Invoking the command opens the Graph Properties dialog.
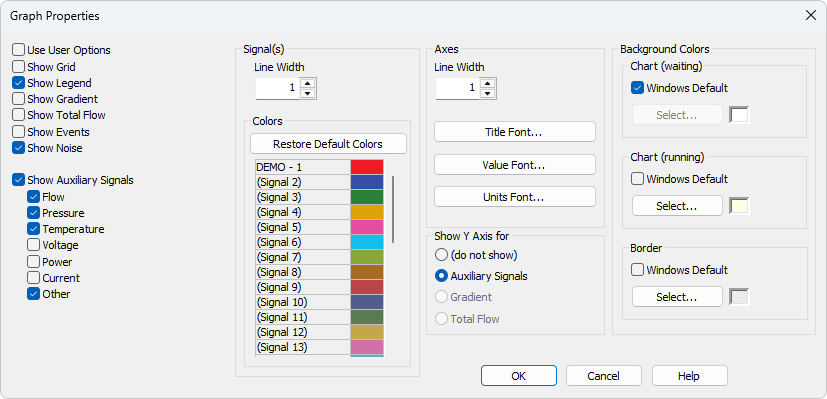
Graph Properties
All parameter settings will be taken from the global settings of the Graph, Axes Appearance and Signals & Curves tabs of the User Options dialog, accessible from the
Shows/hides auxiliary grid for easier reading of values in graph.
Shows/hides names of the individual signals including the eventual subtraction chromatogram and background chromatogram.
Shows/hides gradient when using direct control of LC pumps.
Shows/hides total flow when using direct control of LC pumps.
Shows/hides the events from the Event Table in the Data Acquisition window.
Shows/hides the Noise value (along with appropriate units) in the upper left corner of the graph. Noise in the Data Acquisition window is calculated using the cubic interlining to reduce the influence of the trend to its values.
In the Chromatogram window and Results tab the Noise values are calculated using the linear interlining on the interval defined in the Integration table. If there is a peak in this interval, it will influence the noise values. If there are multiple intervals defined in the Integration table the last one will be applied.
This section determines which auxiliary signals will be displayed in the graph of the Data Acquisition window. Each auxiliary signal is included in one of the following categories: Flow, Pressure, Temperature, Voltage, Power, Current and Other. Note those options are only available if they are available in the configured devices.
Selects the curve width in points.
Selection of color of the signal .
Restore Default Colors - Sets the display colors to the default state. It will be overridden by Use User Options if checked.
Select… - Click the particular color to change it.
Axes
Selects the axes width in points.
Selects the font for graph axes title.
Selects the font for numerical figures on axes.
Selects the font for displayed units of axes.
Show Y Axis for
Determines whether the second (right) Y axis will be displayed and for which signal. The axis may be displayed for the Gradient (the percentage rate of individual compounds), Total Flow or Auxiliary Signals. The Show Gradient and Show Total Flow options must first be checked in order to display the Y axis for this particular signal. Applies only to the directly controlled devices with auxiliary signals.
Sets the color of the graph background (surface of the graph between axes).
Windows Default - Sets the initial color of Windows system.
Select… - Serves for selecting of the desired color.
Sets the graph background color (surface between axes) when the analysis is running. Setting a different colored background to the graph enables you to quickly differentiate as to whether an analysis is actually running or if the detector signal is merely being monitored in the Data Acquisition window.
Windows Default - Sets the initial color of Windows system.
Select… - Serves for selecting of the desired color.
Sets the color of the window background (surface outside axes).
Windows Default - Sets the initial color of Windows system.
Select… - Serves for selecting of the desired color.