Graph tab
Tabs: General - Graph - Axes Appearance - Signals & Curves
Sets the appearance of the graphs. This selection applies to all graphs when the local setting in the Graph Properties - Graph dialog has the Use User Options checkbox selected.
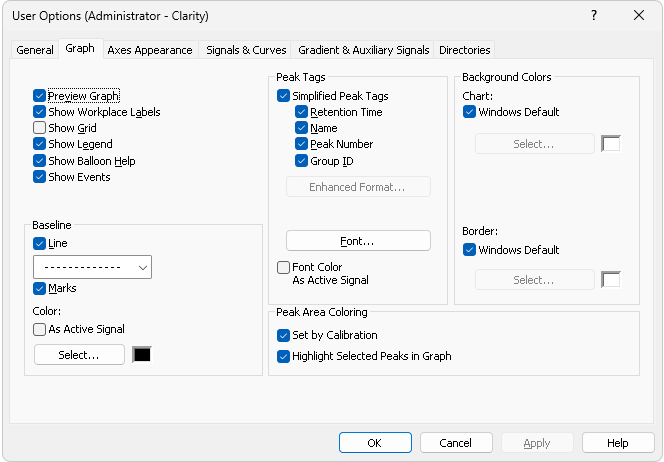
User Options - Graph
Shows/hides a preview graph.
Shows/hides labels and lines assigned to the Workplace using the Create Label command.
Shows/hides a grid for simplified graph reading.
Shows/hides a legend displaying signal names, their corresponding chromatogram names, and their colors in the graph.
Displays balloon help next to the cursor lines when user performs interactive modifications of the chromatogram. This feature can also be switched on/off using the  icon on the toolbar in the Chromatogram window.
Shows/hides visual representation of events from the Event Table tab of the Method Setup dialog.
Line - Shows/hides the baseline.
Marks - Shows/hides marks of peak starts and ends.
As Active Signal - Determines whether baseline color will be the same as the signal color. If not, it will be the color set by the Select button.
Select - Button for color selection.
Allows to shows or hide peak tags or set enhanced format of tags.
Enables/disables checkboxes concerning simplified peaks tags. Simplified tags follows the changes of retention time caused by Scale and Offset parameters of Time Axis settings.
Retention Time - Retention time.
Name - Peak names made according to calibration file.
Peak Number - Peak serial number.
Group ID - Name of group to which a peak belongs.
Displays the Peak Tags Format dialog which allows to set custom format of peak tags. Available only if the Simplified Peak Tags checkbox is unchecked. By default the format is empty, so when Simplified Peak Tags are unchecked and user does not set the enhanced format, no tags are displayed.
Enhanced peak tags are derived from the result table, thus changes on Time Axis does not influence them.
Sets font for peak tags. When prompted, the standard Font dialog will be displayed.
Determines whether the peak tag color will be the same as the active signal color. This overrides the color set by the Font… button.
Set by Calibration - The area of peaks will be colored based on the color specified in Calibration Summary Table (Peak Color column).
Highlight Selected Peaks in Graph - When checked, selecting a peak in either the chromatogram graph or the Result Table (including the All Signals Result Table) highlights it in both places. When unchecked, the peak is highlighted only in the tables, not in the graph.
Selects the background color - Chart section - and border color - Border section - of a graph.
Windows Default - Color will automatically be adopted from the Windows OS appearance scheme. If deselected, the color will be set according to the Select button.
Select - Color selection button.