Result Table
Invoking this command switches the lower part of the Chromatogram window to the Results tab, displaying the Result Table in the left half and the Common for All Signals section in the right half (dedicated to Calculation). When working with a multi-signal chromatogram, the Result Table contains only the active signal results.
Note:
By default, the Highlight Selected Peaks in Graph option in Graph Properties dialog is selected. This causes that the peak(s) corresponding to the active row(s) in Result Table will be colored/highlighted in the Main Graph.
Chromatogram - Results tab - Result Table
The Result Table consists of the Heading, Header Row, Header Column, and columns, which may be predefined or user-defined. The appearance of the Result Table of chromatogram with linked calibration differs from the one without it. For chromatograms without calibration, some of the columns are unavailable.
Note:
The user columns defined in the Result Table and in the Summary Table are independent.
Columns in the Result Table are sorted by Reten. Time by default. Double click a column header to change the column for ordering. Displayed results from the Result Table are printed in the exact order as seen on the screen (WYSIWYG). Changing the signal or opening a new chromatogram does not reset the order to the default (Reten. Time) - this must be done manually.
Note:
After modifying primary data (Scale or Move operations) the Result Table will disappear as the results are no longer valid.
General items
Units in the Result Table
Heading
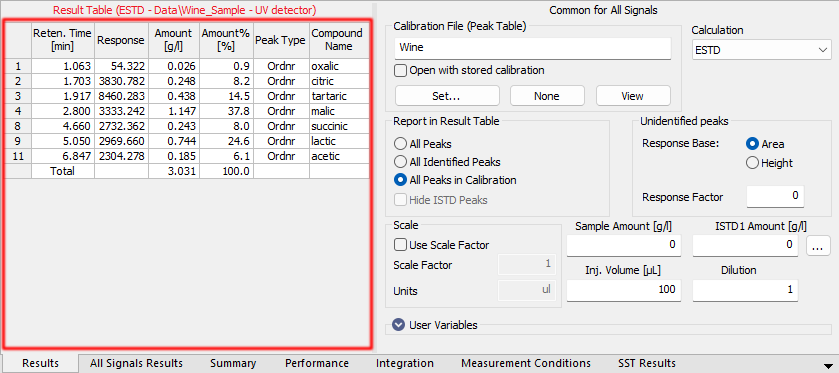
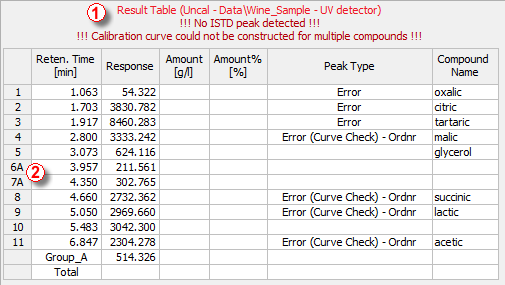
Shows the calibration calculation type, name of the active chromatogram, and in the case of multi-detector chromatograms, name of its active signal. Error messages may appear below the heading providing a description of the cause of the problem (e.g., if it is not possible to use the selected type of calculation).
The heading is always in the color of the active chromatogram (signal) whereas the error is in red. If there are multiple errors, only two will be displayed in a list ①, the remaining messages can be visualized as a tooltip over the visible error messages.
Header Row
Shows the names of columns. A whole column can be selected by clicking the header cell. By double-clicking the header cell, the table is ordered in an ascending order according to the values in the clicked column. Repeated double-clicking rearranges the table in a descending order.
Each column can be moved by clicking on the selected column header cell and dragging the cursor to the desired position. Columns can be widened or narrowed by pressing the left mouse button above the right edge (when the cursor changes to  ) and dragging right or left. By double-clicking above the right edge, the smallest possible width of the column is set, so that the data and column header are entirely visible.
Header Column
Shows the number of a particular peak and the indication of which group the peak belongs to (if applicable) ②. When using the All peaks in Calibration option for the Report in Result Table selection, the compounds present in the calibration but not found in the active chromatogram are indicated with a red number taken from the calibration beginning with the letter C ③.
Chromatogram - Results tab - Result Table details
Columns
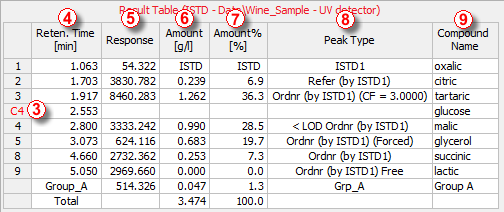
Retention time of peaks in minutes. The peaks in the table are sorted according to their retention time by default.
Area or height of peaks as selected in the calibrated calculation. Hidden by default if no calibration file is selected. The used response type can be viewed in the Response Base (RB) column (hidden by default).
Shows the calculated amounts of compounds in the units set in calibration via the Compound Units parameter of the Calibration Options dialog. These units may by overridden by units entered due to scaling in the Units field of the Scale section of the Method Setup - Calculation dialog or on the Chromatogram - Results tab. See Appendix 1 below for details on calculations. This column is hidden by default if no calibration file is selected.
Shows the percentage amounts of compounds. The total amount is given by the sum of the calculated amounts of compounds in calibration, or by the Amount parameter in the Common for All Signals pane, if this is other than zero. See Appendix 2 below for more detailson calculations. This column is hidden by default if no calibration file is selected.
Shows the type of the identified compound according to the calibration settings. Hidden by default if no calibration file is selected. The type may be a combination of many different items from the following table:
List of possible peak types
| Peak Type | Description |
|---|---|
| Ordnr | Peak which is neither a reference peak nor internal standard. |
| Refer | Reference peak. |
| ISTD1...10 | Peak of an internal standard labeled by the internal standard number. |
| (by XXX) | Indication that the responses of the peak were calculated using the stated ISTD peak (in ISTD calculations) and/or by the response of a different peak (set via the Calculate By function in the Calibration window). Shown in parentheses after the peak type definition (only if the identification or calculation was not performed in the ordinary way). |
| (Forced) | If the peak was identified using the Force Peak Name function from the Chromatogram window, the Forced label is shown in the parentheses. |
| Grp | Indication of a calibrated group. |
| Named Grp | Indication of a named group, if set in the Calibration window. |
| (CF = X) | Indication that the peak uses Correction Factor different than 1. |
| Free | Freely calibrated compound (Free Calibration). The coefficients set in the Calibration window (mainly Manual Response Factor) are used for the calibration calculation instead of the calibration curve. |
| Empty cell is an indication that no calculation has been performed for the given compound. | |
| < LOD or < LOQ | The amount is less than limit of detection (LOD) or quantification (LOQ). These limits can be set in the LOD and LOQ columns in the the Calibration. |
| Error | Indication that calculation for this row could not be performed. This is often caused by the Amount in the calibration being set to 0 or because a part of the calibration curve would result in wrong evaluation (e.g., negative Amount value). Failed result of linearity check (as defined by the Curve Check item in the Calibration Options dialog) is indicated by an Error (Curve Check) (successful checks are not shown). Further description of some of the errors is displayed in the header of the Result table ①. |
Area [detector units.s]
Peak area in the detector units × seconds. Hidden by default if calibration is used. Peak Area is determined as a sum of trapezoid areas defined by vertical lines from the individual data points to the baseline drawn between peak start and peak end.
Height [detector units]
Height of a particular peak in detector units. Hidden by default if calibration is used. Peak Height is determined on vertical line from peak apex to the baseline drawn between peak start and peak end.
Percentage representation of peak area or height. Hidden by default if calibration is used.
Shows the width of the peak in half of its height. Hidden by default if calibration is used.
Displays the name of the compound from the calibration file corresponding to the relevant peak based on identification by retention times. If a certain peak is not identified, the Peak Type and Compound Name columns for that peak are empty, and the Amount field value is zero (unless the Response Factor parameter in the Unidentified peaks section is not equal to zero).
Start Time/End Time [min]
Retention time of particular Peak Start/Peak End. Hidden by default.
Apex Value [detector units]
Shows the y-axis value of the apex of a peak. Hidden by default.
Start Value/End Value [detector units]
Height of the baseline in the Peak Start/Peak End. Hidden by default.
Start Value (Signal)/End Value (Signal) [detector units]
Height of the signal in the Peak Start/Peak End. Hidden by default.
Denotes the response base of the particular peak when calibration is used (A stands for area, H for height). Unidentified peaks use the response base according to the Response Base parameter set in the Unidentified Peaks section. Hidden by default.
Shows the Retention Index (Kováts Index) for the given peak. The calculation of the Retention Index is performed according to the value set in Calibration in the Reten. Index column and the selection of the Retention Indexes use Log. Interpolation with Unretained Peak checkbox in the Calibration Options dialog. The column is hidden by default and it is available only in the Result Table for chromatograms with calibration.
Note:
The equations used for the calculation of Kováts Indexes are described in the chapter "Calibration Options"
Centroid [min], Variance [min2], Skew [-], Excess [-], Asymmetry [-], Capacity [-], Efficiency [th.pl], Eff/l [t.p./m], Resolution [-], Symmetry/Tailing [-]
These columns belong to functions used in the Performance Table on the Chromatogram - Performance tab. Hidden by default. When displayed in the Result Table, the calculation of Efficiency and Eff/l columns is performed according to the Column Calculation selector on the Performance tab, while the remaining columns are calculated according to the mode under which they appear in the Performance Table regardless of the Column Calculation selector state. More information can be found in the chapter "Performance Table "
Displays the compound according to which the given peak was calculated. The Calculate By option is set in the Calibration window. Hidden by default.
This column displays the ratio of Response and Amount.
Response Factor = Amount / Response
It is possible to calculate response factor in the inverse form ( RFinv = Response / Amount ) by checking the Response Factor as Response / Amount checkbox in Calibration Options. Hidden by default.
Displays the value of the Correction Factor as set for the peak in the Calibration window. Hidden by default.
Special rows
This row is visible only in the case that peak groups are used; one for each group. It shows the sum of values of individual peaks belonging to the group in the given column (only for columns when such total makes sense). Setting Peak Color for Groups in the Calibration highlights respective peaks in the chromatogram as well as their background color in the Result Table header row cell.
This row shows the total value of a given column (only for columns where such a total makes sense). For example, Total is not calculated for the Response column, since the data may have different Bases. If a non-zero Amount value is given in the Common for All Signals section of the window, the Total of the Amount column is replaced by this value. Values for ISTD peaks are not included in the Total values (this applies on the Area, Height, and Amount columns).
If an identified peak is evaluated as part of a group, the Total row includes it only within the group. The individual peak values are ignored so that the peak is included only once.
This row is visible only in the case that named groups are used; one for each group. Named group values appear in the row (rows) below the Total row and are not included in the Total itself. The sum of amounts of individual peaks belonging to the named group are stated. Setting Peak Color for Named Groups in the Calibration highlights background color in the Result Table header row cell but not in the chromatogram itself, as each peak may belong to more than one Named Group unlike for standard groups.
Color, if set in the calibration, will be displayed in the header row cell.
Appendix 1
The calculation is determined by the type of calibration:
| Calculation | Formula |
|---|---|
| ESTD, NORM | |
| ISTD | If the calibration does not have ISTD amount filled on any level, this equation is used. Same amount of the internal standard is considered to be present both in samples and in calibration standards, ISTD Amount values everywhere in Clarity are set to 0. |
| ISTD | If the calibration contains ISTD Amount filled on at least one calibration level, following equation is used. ISTD Amounts then must be filled in everywhere in Clarity, both in unknown samples and in the calibration file, and these amounts may differ. |
where:
Explanation of used symbols
| Symbol | Description |
|---|---|
| Amount of component "i" in sample. | |
| Response of the "i" component (height or peak area). | |
| Response of internal standard (height or peak area). | |
| Amount of "i"th component read out from corresponding calibration curve. | |
| Amount of "i"th component read out from corresponding calibration curve displaying dependence of response ratio (Ri/RISTD) of calibration standard on "i"th component amount in that calibration standard for given substance. | |
| Value read out from corresponding relative calibration curve, displaying dependence of response ratio (Ri/RISTD) of calibration standard on "i"th component amount ratio (Amounti/AmountISTD) in that calibration standard for given substance. | |
| Amount of internal standard added to unknown sample. This value must be entered into both the ISTD Amount field in the chromatogram heading and the Amount column of the calibration, or to none of these places in case all ISTD Amount values are the same (optional, the calculation works the same if the same amounts are included on both places). | |
| Multiplication factor. |
In the case that the corresponding peak is not found in the calibration file, the Uncal. Response parameter from the Method Setup - Calculation dialog is used for the calculation instead of deriving the value from the calibration curve, according to the formulas:
Calculation formulas for non-calibrated peaks
| Calculation | Formula |
|---|---|
| ESTD | |
| ISTD | |
| NORM | The value is calculated exactly like in the ESTD calculation, but with peaks not found in the calibration, no Amount[%] value may be given in this case and the Peak Type column shows the Error label. |
Appendix 2
Calculation of percentage representation: