Chromatogram View
Views: Isoplot - Chromatogram - Spectral - 3D - Peak Purity - Peak Purity Spectra - Spectral Library - Spectral Search
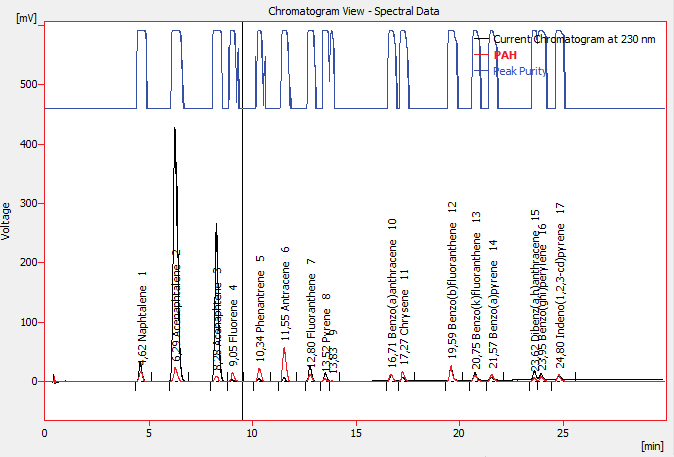
The Chromatogram view displays slices of 3D data defined by the current position of the wavelength marker (Current Chromatogram at X nm). It can also display the Active Signal from the Chromatogram window and/or the Peak Purity (match factor) curve for that signal.
Chromatogram View
The display of Active Signal and Peak Purity curves is controlled either by the settings on PDA Properties - Chrom&Spectral Views dialog tab, or by the Show Active Signal and Show Peak Purity commands from the context menu.
Appearance of the active signal curve can be tailored exactly the same way as in the Chromatogram window using the items on the Graph tab of PDA Properties dialog.
Peak Purity curve is shown in the upper part of the view so that it doesn’t interfere with displayed signals. The values of the curve do not have their own Y-axis, but are displayed in per mille units. Peak Purity curve for particular peak can be viewed in a more detailed way using the Peak Purity View and the Display Peak Purity function.