Spectral View
Views: Isoplot - Chromatogram - Spectral - 3D - Peak Purity - Peak Purity Spectra - Spectral Library - Spectral Search
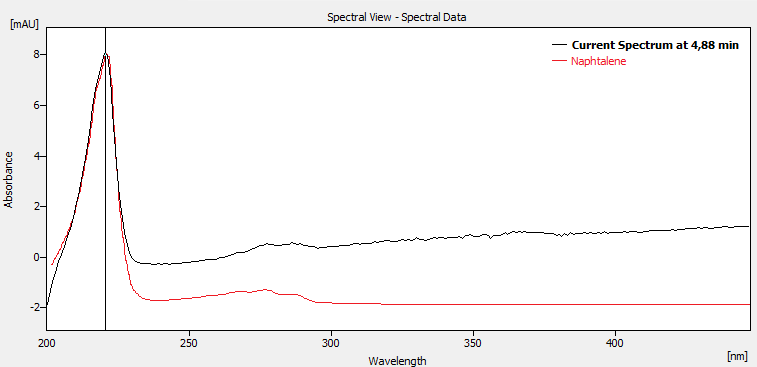
Spectral View visualizes the slice of 3D data defined by the actual position of the time marker (Current Spectrum at X min). It can also display spectra from Spectral Library View and Spectral Search View.
Spectral View
Spectra can be overlaid in the graph using three different modes:
Normalized to the whole wavelength axis range
All spectra are re-scaled (the display only, spectral data stay the same) so that their respective lowest and highest points throughout the whole graph appear at the same level. It is convenient for visual comparison of peak spectra as the shape of the spectra curve does not depend on peak height in this mode. Vertical axis on the left displays values for currently active curve only (its label in the graph legend is shown in bold).
Normalized to zoomed range
This is a more advanced variety of the previous mode - spectra appear normalized as well, but the lowest and highest visible points appear at the same level. This is suitable for the comparison of characteristic regions of spectra.
With normalization turned off
In this mode, all spectra appear in their respective scales.
The particular mode can be selected using the Normalize Zoomed  , Normalize Whole
  , and Normalization OFF
  functions from the Spectrum menu.