Graph Properties - GPC Options
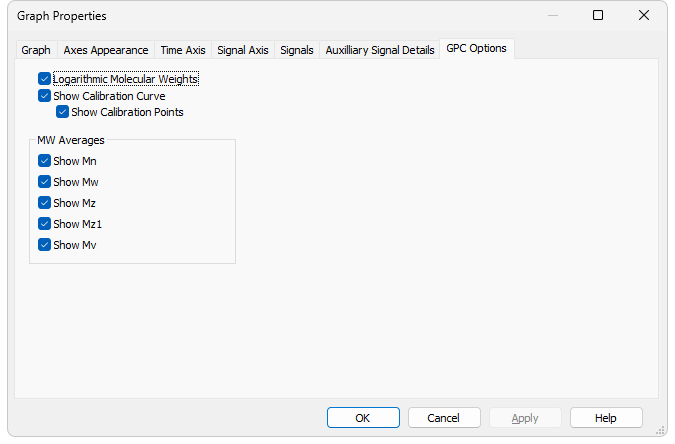
The GPC Options tab of the Graph Properties dialog is used to customize the appearance of the curves displayed on the Chromatogram tab of the Chromatogram window.
Graph Properties - GPC Options
Logarithmic Molecular Weights
Sets the format of the molecular weight axis (right Y-axis) showing the units for the overlayed GPC calibration curve. If checked, shows the units as the logarithm of the MW, while unchecked displays the non-linear axis in MW.
Show Calibration Curve
Switches the display of the GPC calibration curve overlayed over the signal graph on the Chromatogram tab of the Chromatogram window on and off.
Show Calibration Points
Switches the display of the calibration points for the GPC calibration curve overlayed over the signal graph on the Chromatogram tab of the Chromatogram window on and off.
MW Averages
Switches the display of the particular points in the active signal graph displayed on the Chromatogram tab of the Chromatogram window. More information on these points can be get in the chapter "GPC Results"