GPC Results
The GPC Results tab contains the Result Table with calculated molecular weight distribution parameters for the active signal and the Common for All Signals section with shared evaluation settings.
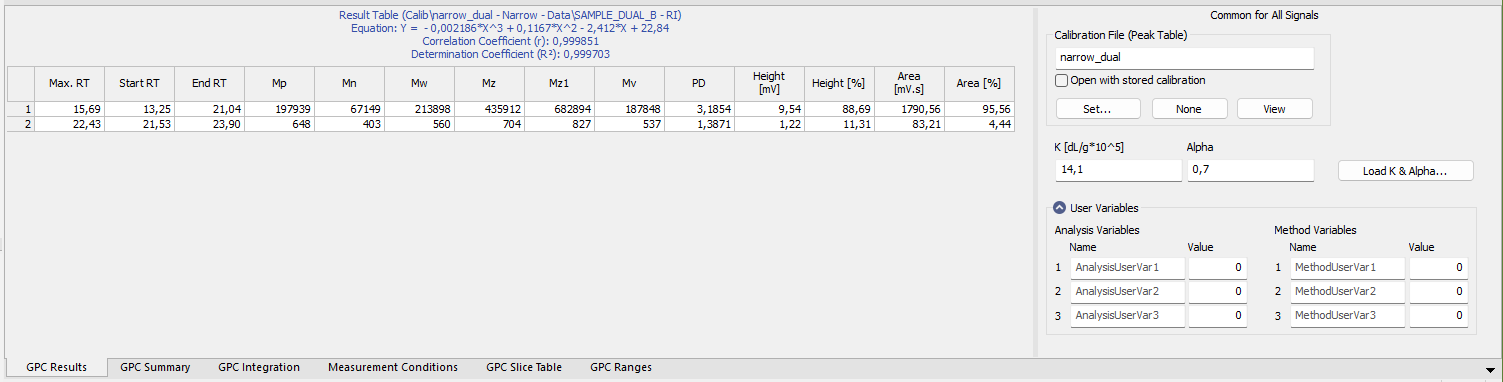
Result Table
The Result Table displays molecular weight distribution parameters calculated for the currently selected signal. The following columns can be displayed in tables:
List of columns available in the GPC Extension
| Column name | Description |
|---|---|
| Max. RT | Retention time of peak maximum |
| Start RT | Retention time of peak integration start |
| End RT | Retention time of peak integration end |
| Mp | Molecular Weight at peak maximum |
| Mn | Molecular Weight number average |
| Mw | Molecular Weight weight average |
| Mz | Molecular Weight Z average |
| Mz1 | Molecular Weight Z+1 average |
| Mv | Molecular Weight viscosity average |
| PD | Polydispersity (Mw/Mn) |
| Flow Rate Correction | Flow rate correction factor |
| Height [mV] | Peak height |
| % Height | Percentage of total height of evaluated peaks |
| Area [mV.s] | Peak area |
| % Area | Percentage of total area of evaluated peaks |
Additional columns can be displayed or calculated using the Setup Columns... and User Columns - Add... commands from the local menu.
The Common for All Signals section defines parameters shared by all evaluated signals within the chromatogram.
Calibration File (Peak Table)
Specifies the calibration file used for evaluation. In GPC Mode, this field links the chromatogram to a GPC calibration (*.gal). Functionally, it behaves the same as in the standard Chromatogram window – it determines which calibration file is applied for calculations.
The Set…, None, and View buttons provide standard calibration handling options.
K & Alpha
Displays the Mark–Houwink parameters used for molecular weight calculations. These values correspond to the parameters defined in the Sequence or Single Analysis dialog at the time of measurement.
The parameters can be edited in the K & Alpha dialog, which is opened using the Load K & Alpha… button, but the selection of the line does not affect the K & Alpha values in the chromatogram.
Values may be modified directly in this section in the chromatogram window if required.
When a non-universal Narrow calibration is used (standards and unknowns of the same polymer), the K and Alpha parameters are not applied to the calibration curve or molecular weight results.
User Variables
User Variables function without differences compared to the standard mode.