GPC Slice Table
The GPC Slice Table tab displays the Cumulative Molecular Weight Distribution Table for the active peak. In signals with multiple evaluated peaks, the peak is set active by clicking on its row in the Result Table on the GPC Results tab for the respective signal. The table appearance can be modified using the Setup Columns... command from the local menu.
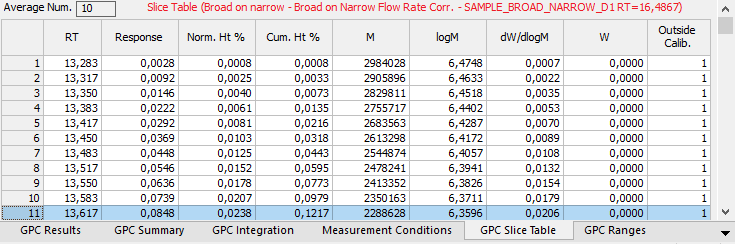
Chromatogram - GPC Slice Table
The number of slices depends on the peak length and Peak Width value used in the Integration Table on the GPC Integration tab. The slices can be averaged by entering a number in the range <1, 100> to the Average Num. field in the table title area. For the integrated peak, following values are available for the specified time intervals (slices):
RT
Retention time of the slice (averaged).
Response
Slice peak height (averaged).
Norm. Ht
Normalized slice height (summed).
Norm. Ht %
Percentage of the slice height from total of all slices height (summed to give total 100%).
Cum. Ht
Cumulative slice height (averaged).
Cum. Ht % Graph
Cumulative percentage of the slice height from the total of all slice heights in the inverse order (increasing with increasing M) (averaged).
Cum. Ht %
Cumulative percentage of the slice height from the total of all slices heights (averaged).
M
The molecular weight corresponding to the slice retention time (averaged).
Log M
The logarithm of the molecular weight corresponding to the slice retention time (averaged).
dW/dlog M
Normalized distribution of slice molecular weights used for the graph in the MW Distribution tab.
W
Normalized slice height used for molecular weight distribution calculation.
Outside Calib
Flag marking whether the slice is inside or outside of the used calibration retention time range. Outside of the range gives value 1, while inside the range gives value 0.