MW Distribution
The MW Distribution tab in the Graph pane of the Chromatogram window shows the molecular weight distribution of the active peaks from the (possibly overlaid) signals or chromatograms. In signals with multiple evaluated peaks, the peak is set active by clicking on its row in the Result Table for the respective signal. The retention time of the active peak is indicated at the end of its legend in the Graph pane.
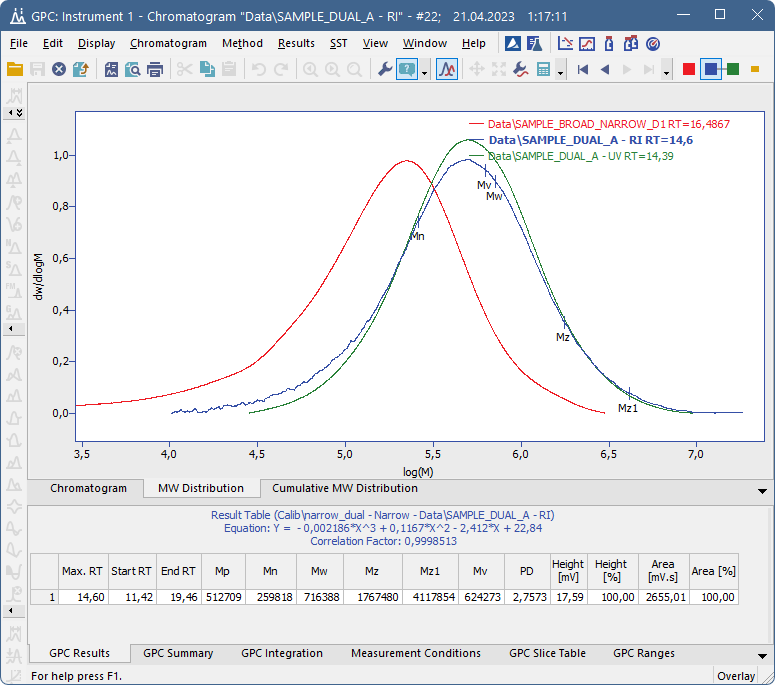
Chromatogram - MW Distribution