Results
The Result Table of a PDA chromatogram is expanded by the following columns: PDA Peak Purity, PDA Name Match, PDA Best Match Name, and PDA Best Match. It is possible to change the order of the columns or hide some of them using the Edit - Setup Columns... command.
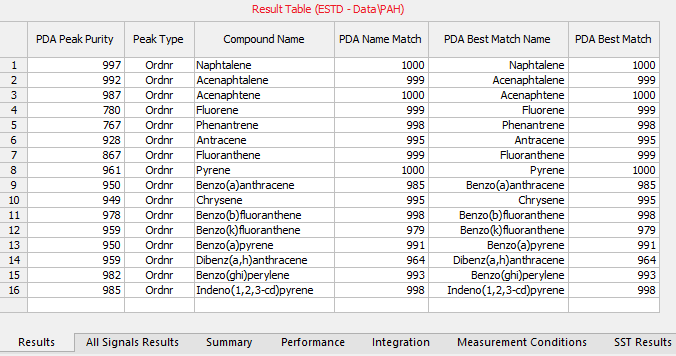
Result Table with the PDA data
Displays the PDA Peak Purity value of the peak. In the case the Peak Purity is calculated using the Five points method (as described in the chapter "Method Setup - PDA Method") and the Absorbance Threshold is set too high to be over peak inflexion points, an Error result is displayed with a tooltip hinting for solution.
The Peak Purity calculation uses the Pearson Correlation Coefficient formula to calculate the similarity of any peak spectra to the apex spectrum. The results are re-scaled to the 0-1000 scale and averaged (five results averaged in case of Five points setting, all spectra similarity results averaged in case of All points setting). Calculation details including formulas can be found in the chapter "Appendix - Mathematical Formulas".
Displays the match factor of the spectrum found in the spectral libraries based on the peak name obtained from the calibration.
If multiple libraries are specified in the PDA Method (Chromatogram - Measurement Conditions - PDA), Clarity will search all libraries for spectra with the same name and display the one with the highest match factor.
Displays the name of the best-matching spectrum found according to the method library search options.
If multiple libraries are specified in the PDA Method (Chromatogram - Measurement Conditions - PDA), Clarity will search all libraries and choose the spectrum with the highest match factor. The name of the library where the match was found is shown as a tooltip when you hover over the corresponding cell in the Result Table.
Displays the match factor of the compound from the PDA Best Match Name column.