Adjusting display of chromatogram
You can customize the appearance of the chromatogram graph using the Graph Properties dialog available in the Chromatogram window to suit your specific needs. Below are a few useful examples of how you can adjust the display to better highlight the information you care about.
For tips on how to work with multiple signals/chromatograms, see the Working with individual signals of a multisignal chromatogram smoothly topic.
You can open the Graph Properties dialog either by right-clicking in the chromatogram graph area and selecting it from the local menu, or via the Display - Properties... menu.
Automatically scale the signal Y-axis to the integrated region
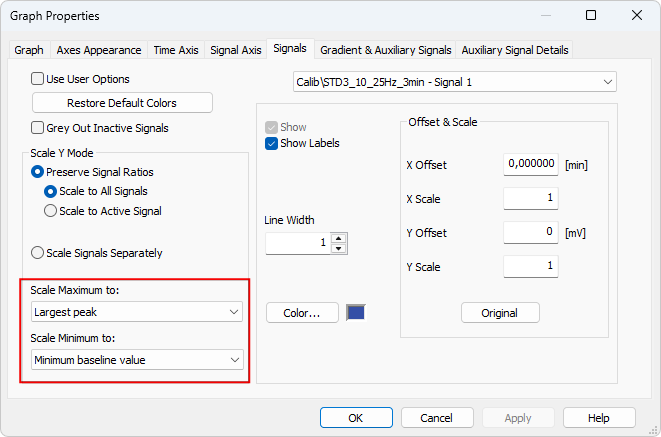
In Graph Properties, go to the Signals tab, where you can set how the signal axis is automatically scaled.
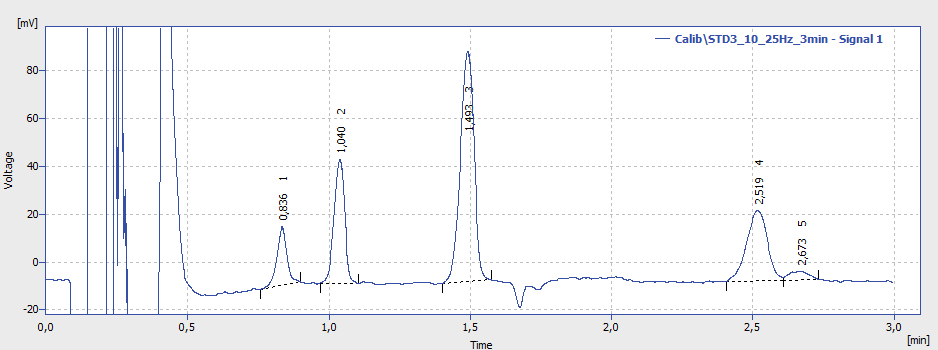
If your chromatogram contains a large, unimportant spike that is not integrated, you can improve the visibility of relevant peaks by adjusting the scaling options:
- the Scale Maximum to Largest Peak
- the Scale Minimum to Minimum Baseline Values (recommended if you do not evaluate negative peaks)
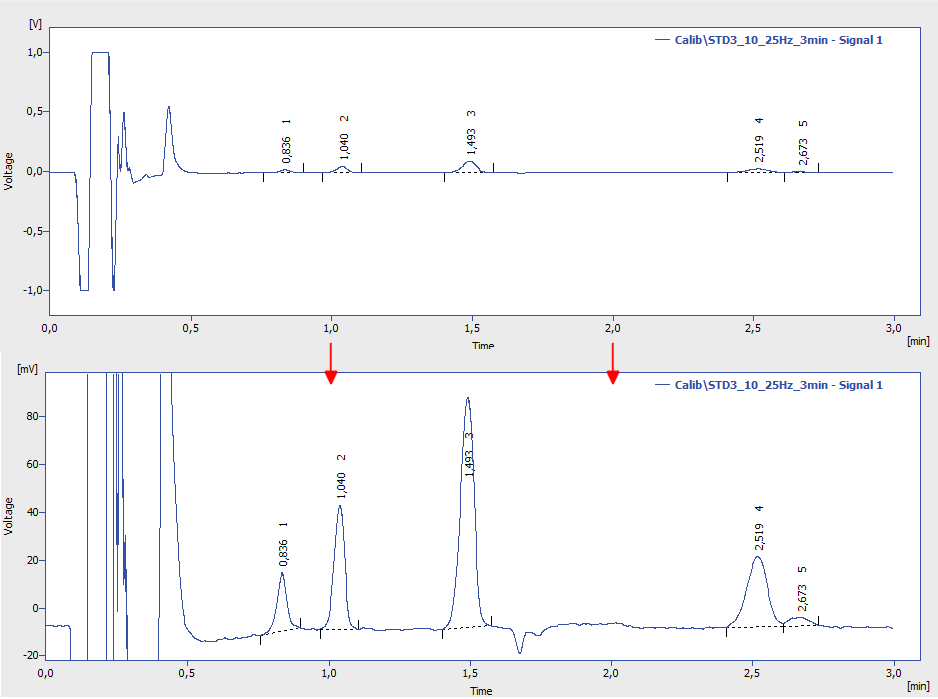
This centers the display on the integrated region, improving visibility of smaller peaks that would otherwise appear tiny due to large, unrelated spikes at the beginning.
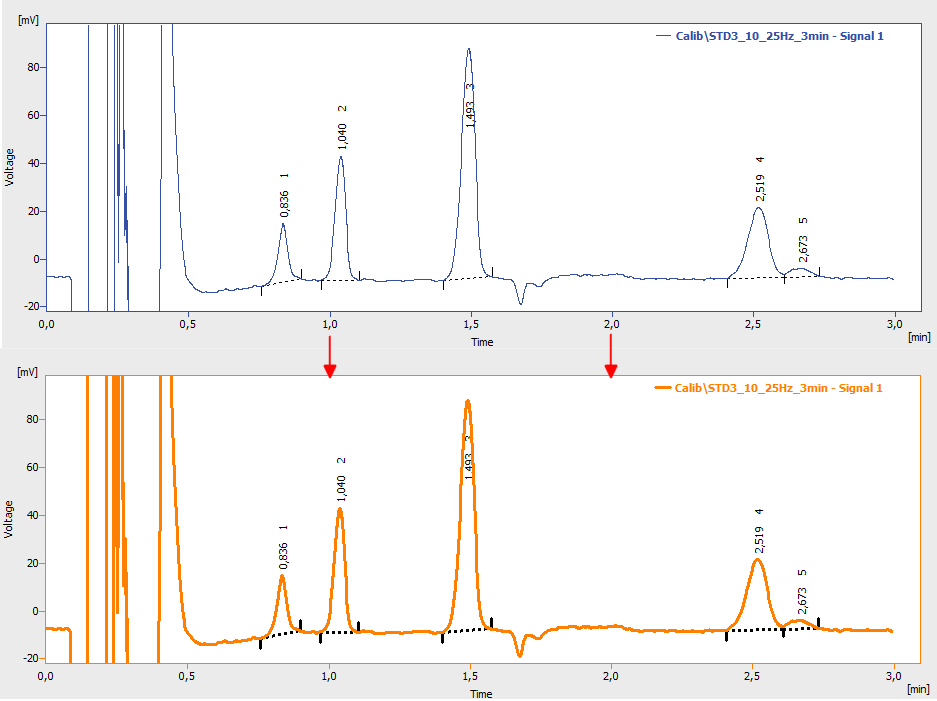
Changing the color and thickness of the signal line
In Graph Properties, go to the Signals tab. For each signal, you can customize its appearance:
- Click the Color button to choose a different color.
- Adjust the Line Width value to make the signal line thinner or thicker.
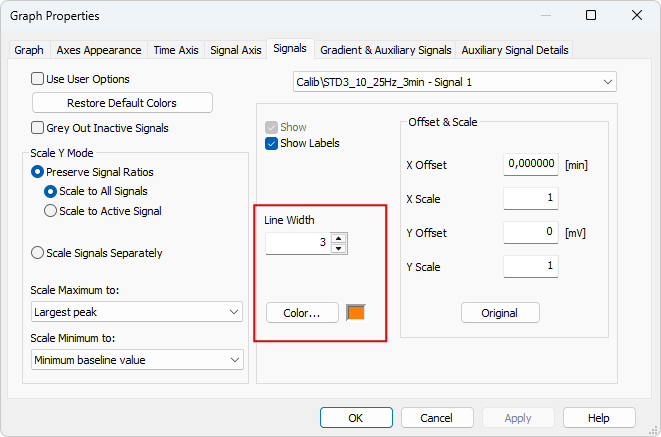
This setting allows you to match your visual preferences and improve readability.
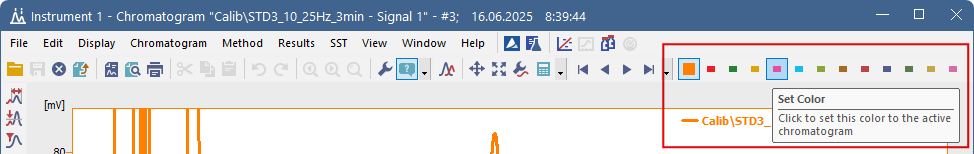
Alternatively, you can change the color of a signal directly from the toolbar: click a color box that is not currently used (i.e., not assigned to any open signal). The selected color will then be applied to the active signal.
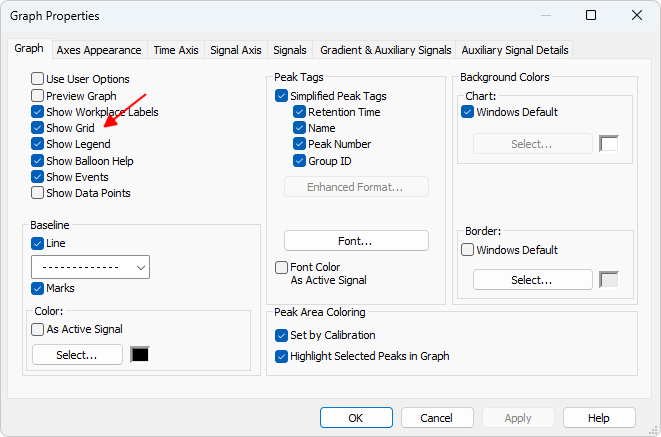
Showing the grid
In some cases, it can be helpful to display grid lines in the chromatogram graph - for example, to better align peaks or assess retention times.
You can enable this option in the Graph Properties dialog. Go to the Graph tab and select the Show Grid checkbox.