Following articles will describe how to perform some of the most common calibration modifications that can improve your calibration. Using this guide you manage to fit your calibration closer to your analytical application.
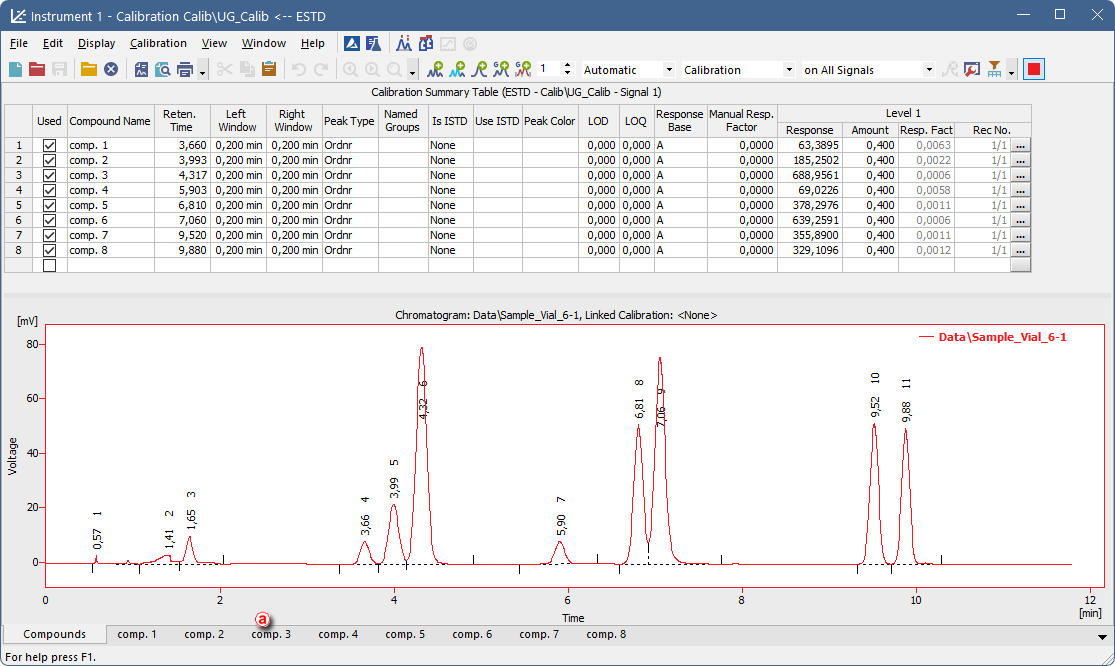
Once you added all chromatograms to your calibration and filled Amount values for all compounds and all levels, you can start to adjust it. Note that the Amount values are the values you know, because they originate from the concentration levels of your calibration solutions. Further adjustments of the calibration are available on the corresponding Compound Tabs at the bottom of the window. In our case, the Comp No. 3 ⓐ is edited.
Modifying Response Base
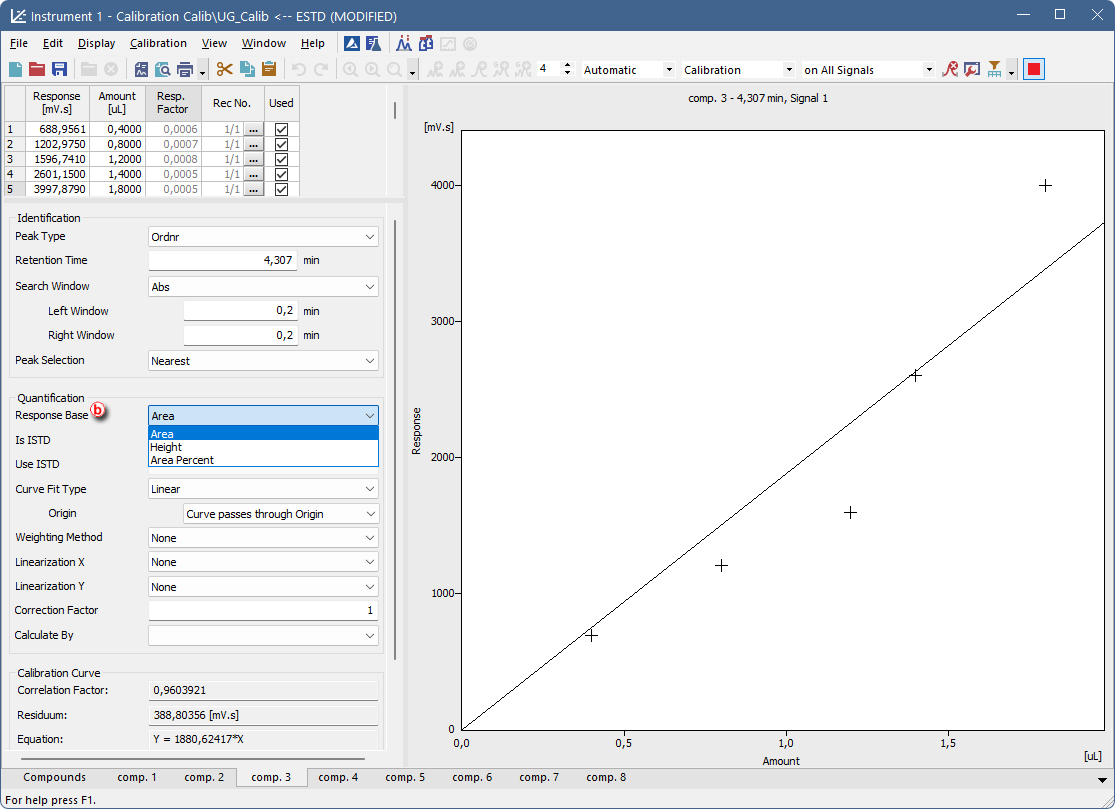
Set the Response Base ⓑ to modify whether the calibration curve will be calculated using Area or Height of the corresponding peak belonging to the specific compound. Changing the Response Base can help to create better fitting of the calibration to not well resolved peaks.
Modifying Origin
Another option how to improve your calibration is setting of Origin ⓒ and its incorporation or exclusion in calibration calculations. In Clarity there are three available setting options, as described on the following images. There is also demonstrated an effect of the Origin setting on calculated Equation and Correlation factor ⓓ.
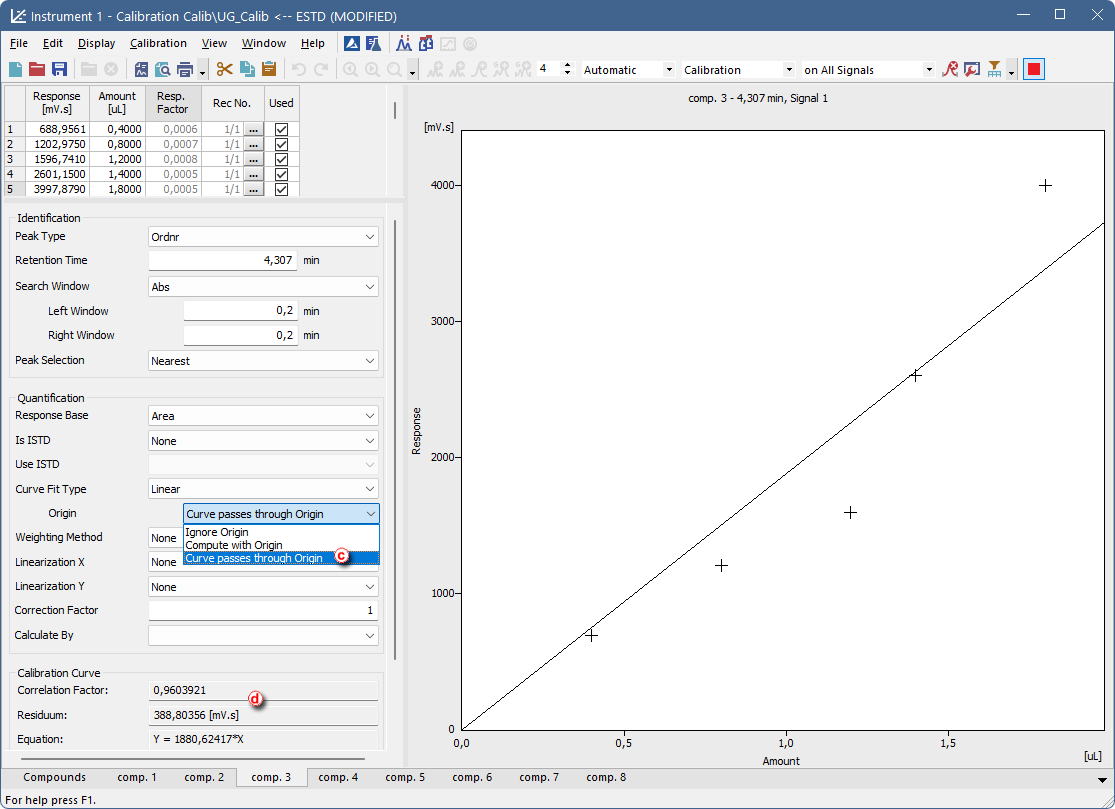
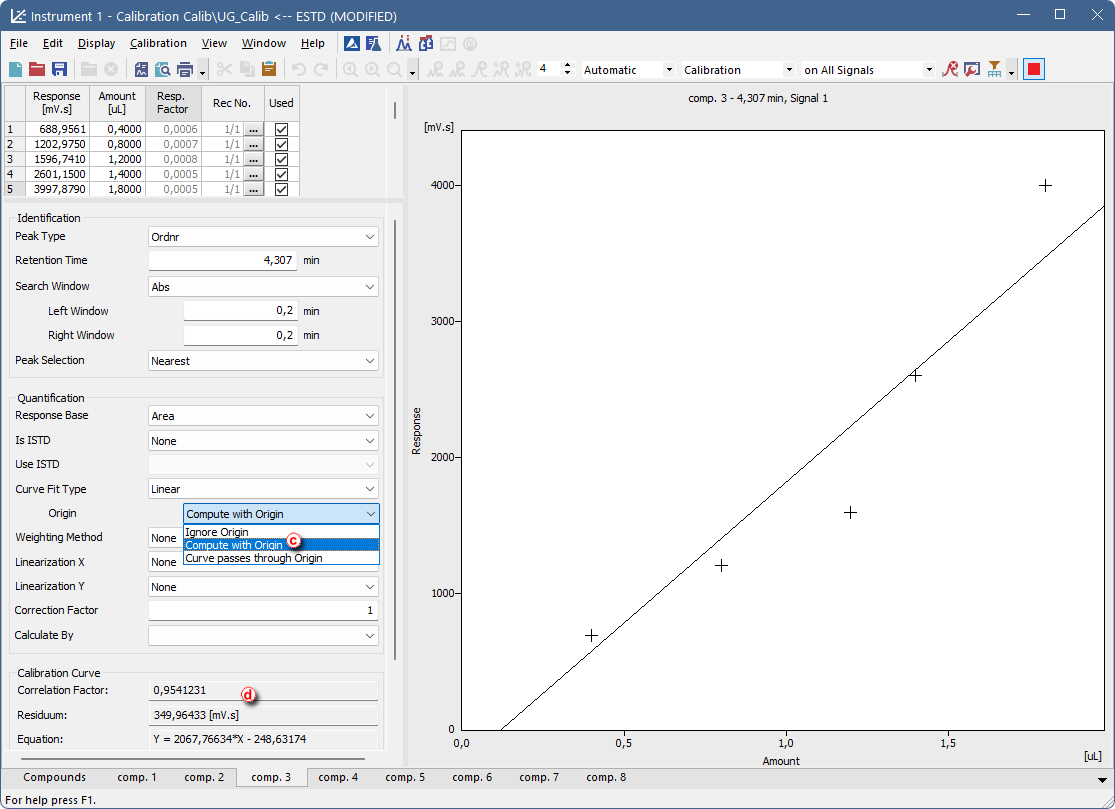
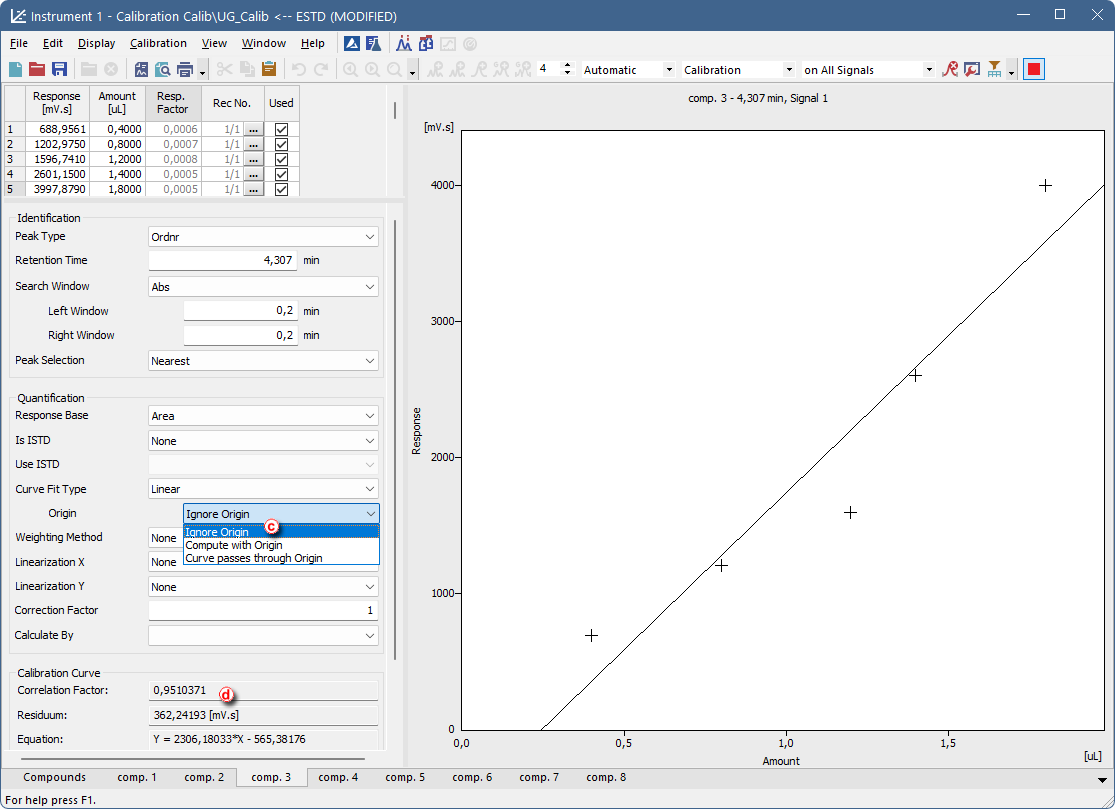
As you can see from the Correlation factor ⓓ values, changing the Origin setting from the Curve Passes through Origin to Compute with Origin improved the curve fit. However, the option Ignore Origin has proved to be the best match for the used detector.
Modifying Curve Fit Type
Following images demonstrate how to modify Curve Fit Type ⓔ from Linear to Cubic. Cubic Curve Fit Type is used as an example of non-linear Curve Fit Types.
- Linear calibration curve is commonly used for detectors with linear response, such as Flame Ionization Detector (FID) or Refractive Index Detector (RID).
- Non-linear calibration curve is typical for detectors such as Electron Capture Detector (ECD) or Evaporative Light Scattering Detector (ELSD).
When changing Curve Fit Type ⓔ pay also attention to the values of the calculated Equation and Correlation Factor. Increasing value of the Correlation Factor indicates better selected Curve Fit Type for the measured data.
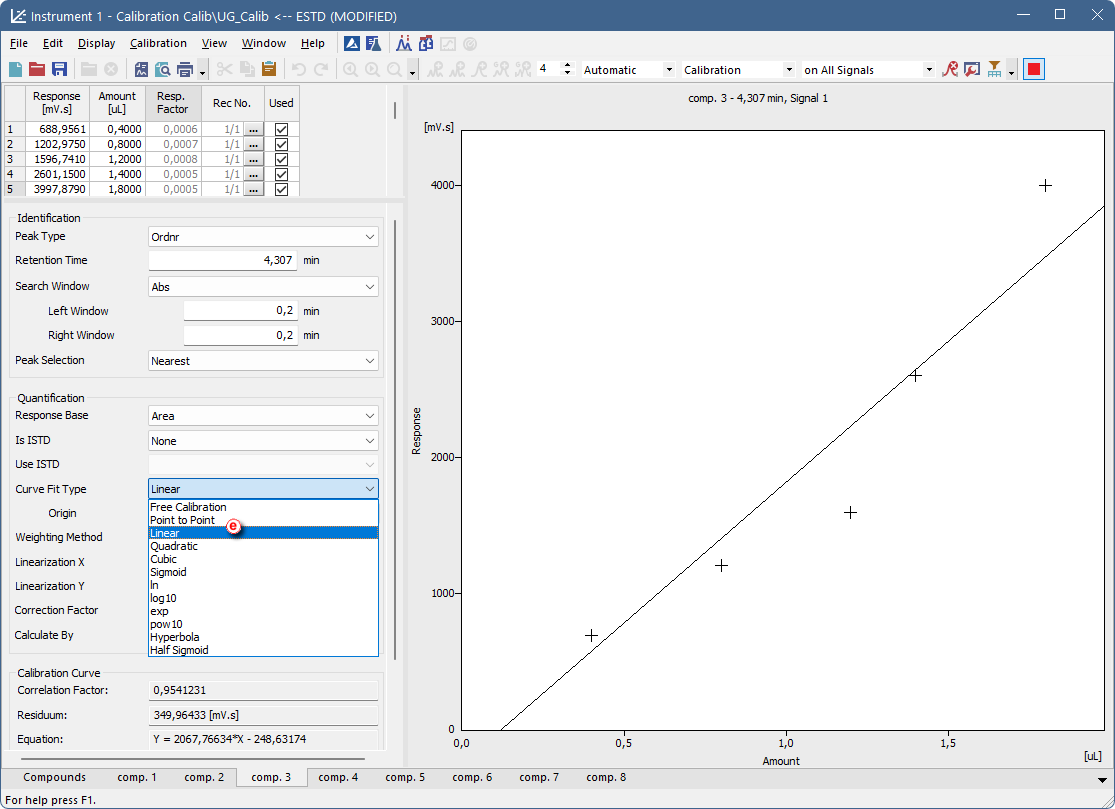
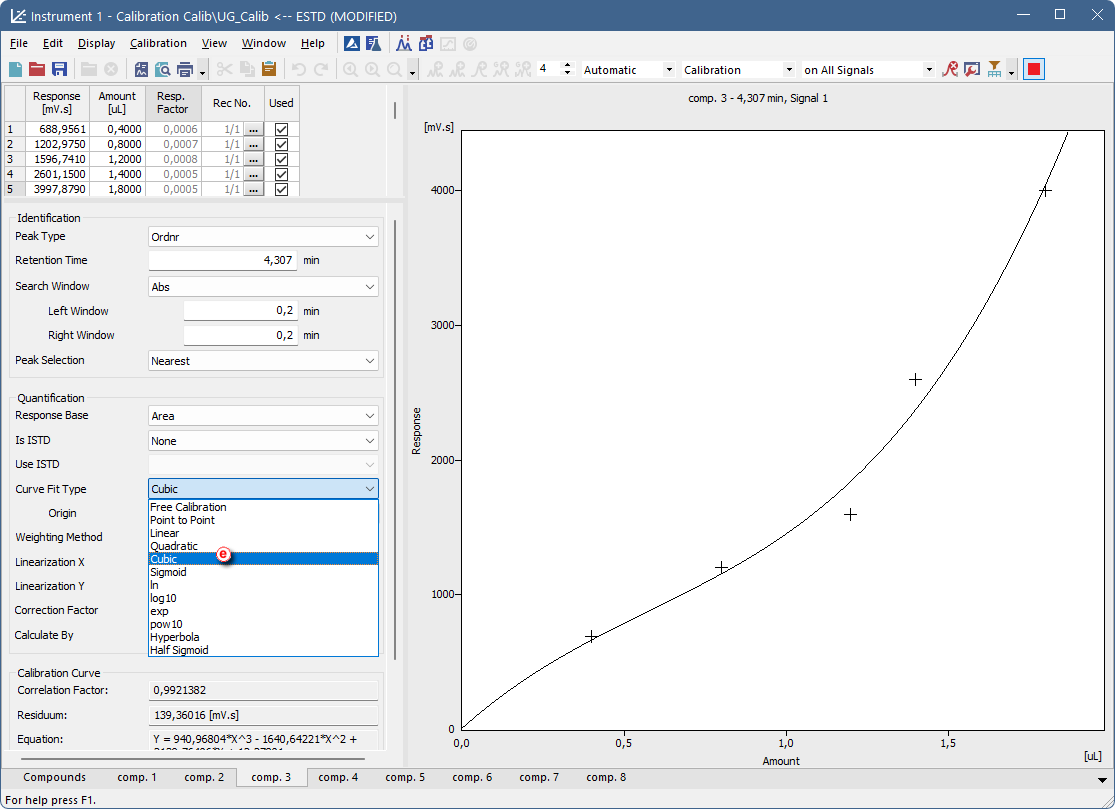
As you can see, changing the Curve Fit Type from Linear to Cubic increased the Correlation Factor from 0.954 to 0.992.
Excluding of Measured Point from Calibration
Clarity also allows excluding any point from calibration. This is helpful in case that the specific measurement went wrong. Following images describe how to do that. Please keep in mind that the excluded point isn’t deleted, the point is still part of the calibration, however, it is omitted from calculation of calibration curve. To exclude the selected measurement point from the calibration simply uncheck that measurement in the Used ⓕ column. The excluded point in the graph of calibration curve will be changed from cross to empty circle ⓖ and calibration curve Equation and Correlation Factor ⓗ will be recalculated.
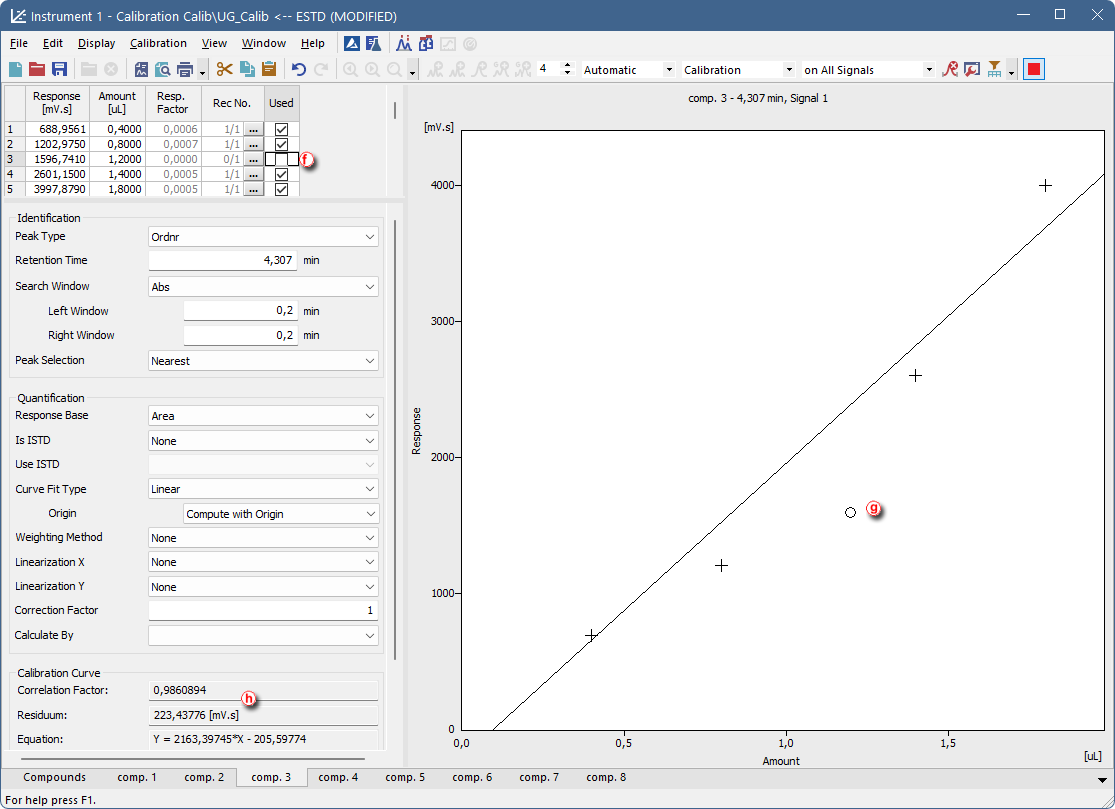
As you can see, excluding the incorrectly measured calibration point resulted in more accurate calibration.