Chromatogram window
Analysis Procedure: Step 1 -> Step 2 -> Step 3 -> Step 4 -> Step 5
- The Chromatogram window can be opened manually by clicking on the Chromatogram
 icon in the Instrument window.
 - The Chromatogram window is divided into two halves: the Graph pane and the Results pane.
- Enlarge any part of the graph by selecting the area to enlarge while holding the left mouse button. Return to the view of the entire chromatogram by double-clicking in the graph.
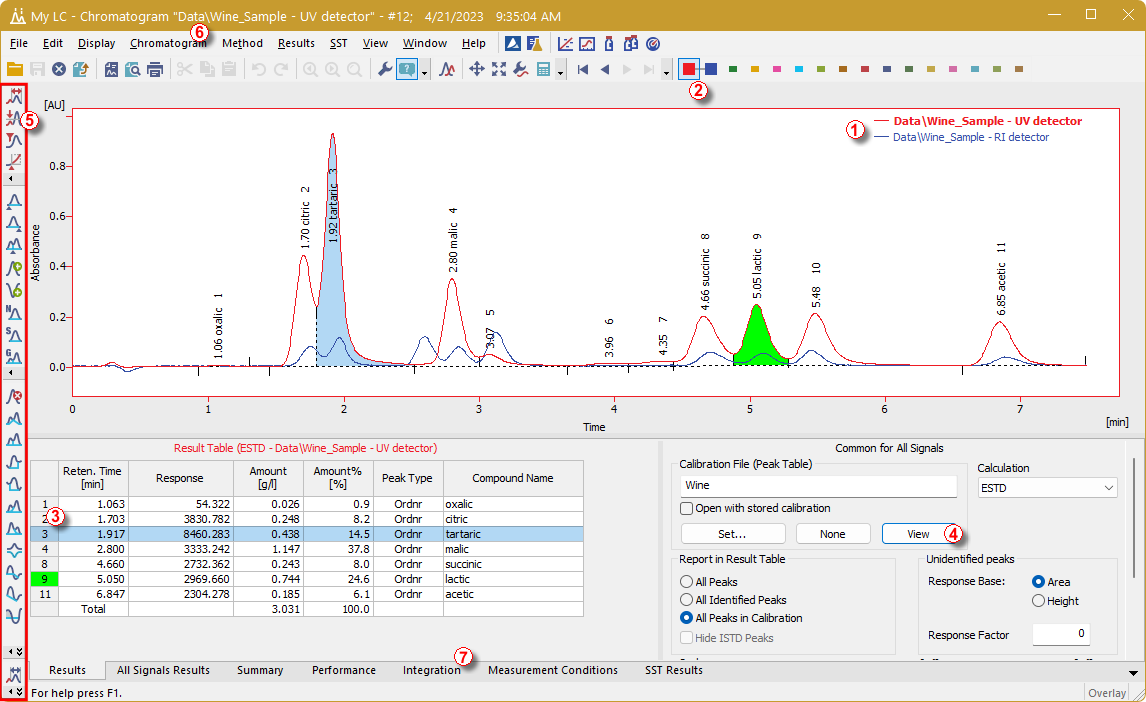
- Only one signal of the chromatogram can be active at a time. The active signal can be recognized from the legend section ① in the upper right corner of the graph (active signal is set in bold), from the icons in the Overlay toolbar ② (the active signal has the highlighted
 icon) or from the graph outline color and table headers color. Values inside the tables change by changing the active signal.
 - Change the active signal by double clicking on its name in the legend section ①. Change the color of the currently active signal to another one by clicking on the Not used color
 icon in the Overlay toolbar. All parts of the Chromatogram window mentioned in the previous step will change color.
 - Click in any row in the Result table ③. The peak (or peaks) corresponding to the row you just clicked into will change color according to the color of the signal. This change will last until the focus in the Result table is canceled.
- To add permanent color to the peak, click the View button ④ in the right side of the Results tab. This will get you to the linked calibration file. There, in the Calibration Summary Table, find the Peak Color column (see Fig "Calibration window - loaded standard"). In the row corresponding to the peak to be colored select the appropriate color and click OK. Return to the Chromatogram window by using the icon in the toolbar. The selected peak is now colored according to the color selected in the Calibration window (green in our case).
- You can change the integration of peaks by using the interactive icons in the toolbars on the left side of the Chromatogram window ⑤, by using commands from Chromatogram menu ⑥ or directly in the Integration tab ⑦. Any changes made either way will change the Integration table and can be copied to the template method. To do so, click on Method - Save as Template... menu command.
Note:
If you want to measure chromatograms with altered integration table, copy the Integration table and paste it into the template method. New chromatograms will be automatically integrated according to these changed parameters. Already measured results can be reprocessed (for more details see also chapter Linking the calibration to the method)
- Before you proceed to work with Instrument 1 (My GC+AS), close the window of Instrument 2 (My LC). It is not mandatory, but it will be less confusing to work with one Instrument at a time only. You will be asked to save any unsaved files.