Graph Properties
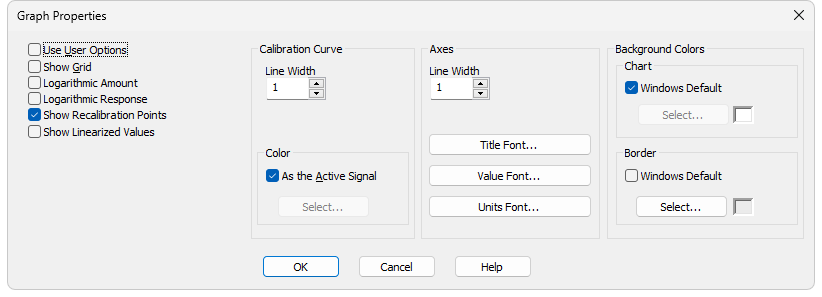
The Graph Properties dialog for the Calibration Curve Graph allows customization of the graph's appearance and display settings.
Graph Properties
Applies global graph settings from the User Options instead of individual customization.
This option is also available from the context menu, accessed by right-clicking in the calibration curve area.
Displays/hides the grid in the calibration curve graph, helping with visual alignment and reading values more easily.
Switches the Amount axis to a logarithmic scale, changing how values are displayed and distributed along the axis.
Switches the Response axis to a logarithmic scale, changing how values are displayed and distributed along the axis.
Displays/hides the spread of individual recalibrations for each calibration point. When disabled, only the averaged calibration point is displayed.
Adjusts the axes and calibration curve in the graph to reflect the applied linearization. When Linearization X or Linearization Y is enabled for a compound, this option updates the graph to display values according to the recalculated calibration curve equation.
Calibration Curve
Line Width - Sets the thickness of the calibration curve in points.
Color - Defines the color of the calibration curve.
As the Active Signal - Uses the color of the currently active signal.
Select… - Opens a color selection dialog to choose a custom color.
Line Width - Sets the thickness of the axis lines in points.
Title Font… - Selects the font for the axis titles.
Value Font… - Selects the font for the numerical values displayed on the axes.
Units Font… - Selects the font for the units displayed on the axes.
Chart - Sets the background color of the graph (the area between the axes).
Windows Default - Uses the default system color.
Select… - Opens a color selection dialog to choose a custom color.
Border - Sets the background color outside the axes.
Windows Default - Uses the default system color.
Select… - Opens a color selection dialog to choose a custom color.