Chromatogram Graph
Chromatogram Graph
Displays the chromatogram including the baseline, thus enabling interactive adjustment of the baseline and many other functions. Method of graph display is set by Display - Properties command.
It is possible to select cut from chromatogram, simply by dragging the cursor over desired area with left mouse button pressed. The cut can moved along the whole chromatogram, by dragging with mouse (with Ctrl + left mouse button pressed), or by using keyboard arrows. See also the chapter "Display"
Orientation in peaks and their corresponding rows in the Result Table is accomplished by filling the peak with a color after its selecting by clicking the cursor into its area. Corresponding row in Result Table is also highlighted. Selection is abandoned by clicking the cursor out of the peak area. It is also possible to select the row in Result Table by clicking into its first cell on the left (the one with number of peak displayed), corresponding peak in graph will be filled in. Multiple peaks can be selected at a time by clicking into their areas while holding Ctrl key or by clicking into the first and last one while holding Shift key. By default the same color is used for all the peaks (the same as the color of signal curve itself), custom colors can be set for every compound in Calibration (Peak Color column). This feature can be further set in the Graph Properties - Graph tab.
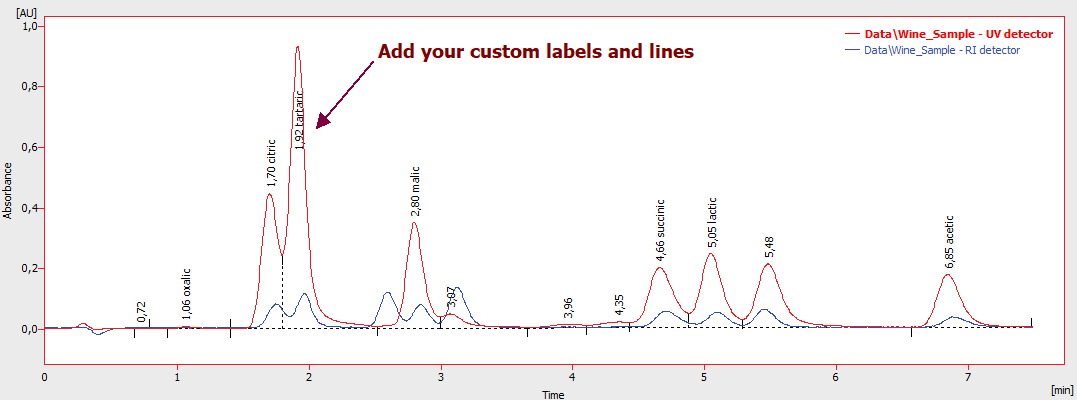
Right click on the graph and select Create Label or select Chromatogram - Create Label on the main menu to add a line or text.
An auxiliary graph where the chromatogram is always displayed in its original size. The graph is designated as an illustration of the cut-out performed in the main graph. Cut-outs may also be performed here, which is particularly suitable for shifting and zooming. The orientation graph is hidden by default, but can be displayed or hidden again by using the Display - Preview Graph command.

Auxiliary Graph
Note:
After reducing the area of the graph below a certain level (e.g. by shifting the border “splitter” upwards) or reducing the overall size of the window, the small overview window (if opened) will hide and to be displayed again after the enlarging the graph, the command Display - Preview Graph have to be invoked once more.
Current co-ordinates of cursor
The current position of the cursor is displayed in the right part window in the space between the orientation and main graphs or above the main graph, if the orientation graph is not displayed.
A legend describing the individual chromatograms (signals) is displayed in the upper right-hand corner of the graph. If you have more chromatograms opened than can fit on the screen,  signs for scrolling the text will appear above and/or below the legend. The currently displayed chromatogram (signal) is highlighted in bold letters.
Double click the Chromatogram/Signal description in the legend to make it active.
Signals (or chromatograms in Overlay mode) can be hidden from view by Ctrl + left mouse click on the relevant colored ![]() icon in the Overlay toolbar or Ctrl + double-click on its description in the legend.
icon in the Overlay toolbar or Ctrl + double-click on its description in the legend.
Hidden Signal will be indicated in the Overlay toolbar by a cross ![]() .
.
Note:
The legend is displayed or hidden by (un)checking the Show Legend checkbox in the Graph Properties - Graph dialog.
When user performs interactive modifications of the chromatogram (adding/removing peaks, shifting peak start, etc.), Clarity displays balloon help tips next to the cursor lines.
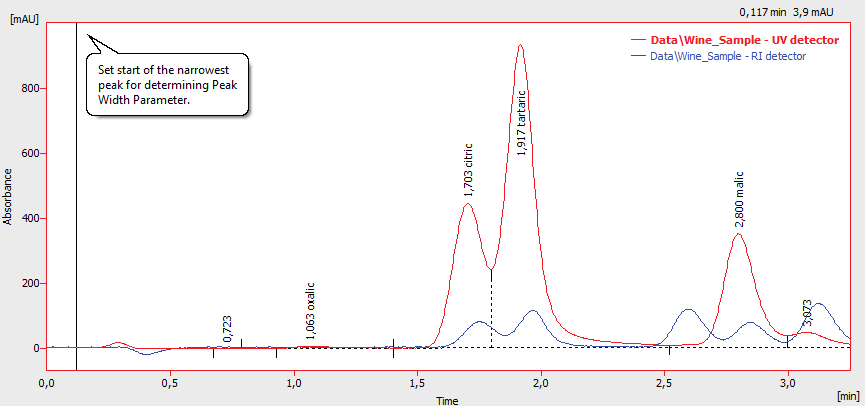
This feature can be switched On/Off using the  icon on the Standard toolbar in the Chromatogram window.