Using DBF in MS Excel
An experienced user can program selected reports in a database program (Access, dBase, FoxPro, SQL). However, not everyone is a database-programming expert. What if we open a database file containing validation results in a common application, for example Microsoft Excel? At first, a complex table will be displayed. Can it be processed in such a way to make it useful?
One option of working with an SST *.dbf file in Excel is to use what is known as Contingency tables:
- Select the whole table in MS Excel, e.g. by using the Ctrl + A key combination.
- Select the Contingency tables and graphs command in the Data menu.
- A “Contingency table wizard” will appear to help you prepare the table (and graph, if applicable).
- In the wizard, you gradually select the required data (database) and location where the contingency table and graph should be created (a new spreadsheet is a suitable option).
- In the last step (3/3) click the layout button and drag the field names onto the table picture to determine the look of the table layout.
- Using the Finish button, create the contingency table and graph.
Note:
This procedure was created for use with MS Excel 2000 and may vary for other versions.
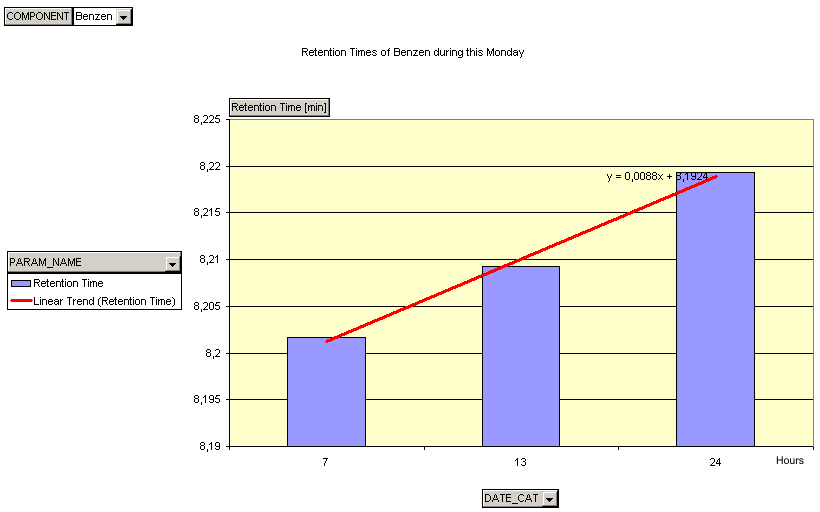
Example of a contingency graph in Excel
Using a contingency table you can, for example, display a detailed overview of the monitored component amount in chromatograms, sort data according to the validation date to compare results for various measurements (e.g. for periodically repeated measurements, or to monitor trends), and so on. Graphs can also be generated simply from the contingency tables using the wizard.
Note:
Detailed information on working with contingency tables can be found in the MS Excel online help section.