To view specific spectra from a PDA library in overlay and thus have the opportunity to compare the current spectrum against spectra from the PDA library, follow the steps below.
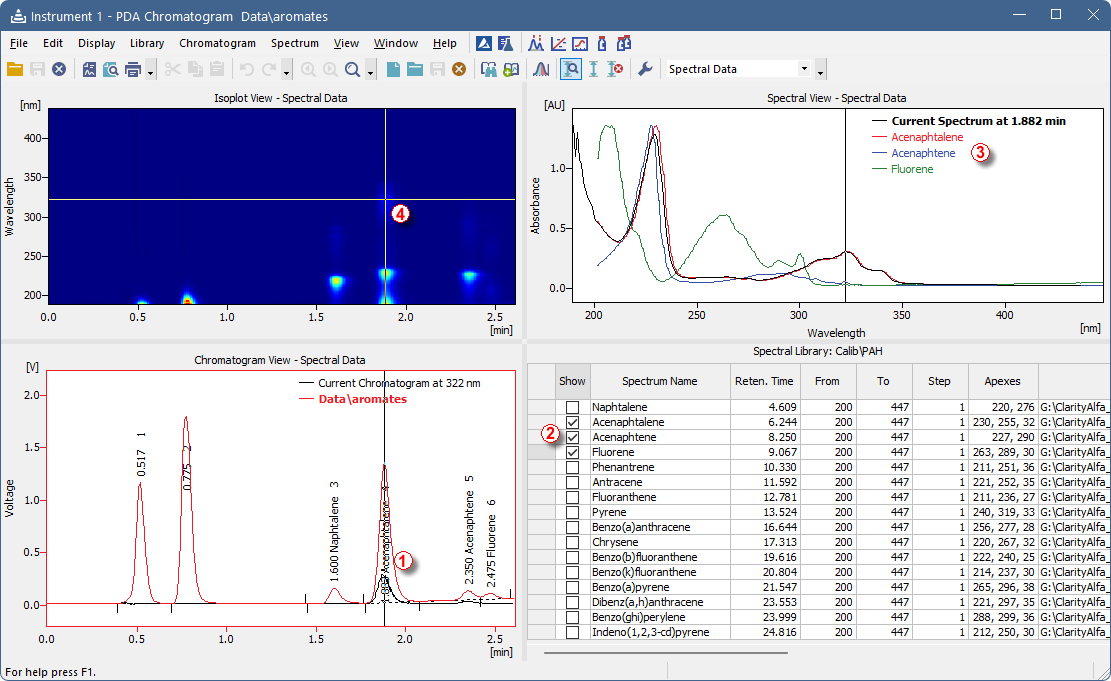
- Used views: Chromatogram View, Spectral Library, Spectral View and Isoplot View.
Note:
How to change views is shown in How to display PDA chromatogram data.
- Move the marker to your desired position ①.
- In the Spectral Library View check the Spectrum Name for each ② spectrum that you want to show in the Spectral View.
- Spectral View displays current spectrum along with other spectra ③ checked in the PDA library.
- You can move the marker ④ in the Isoplot View to move alongside both wavelength and retention time axes.
Note that those steps can be also performed on results from the Library Search - thus having spectra from the search in overlay.
Note:
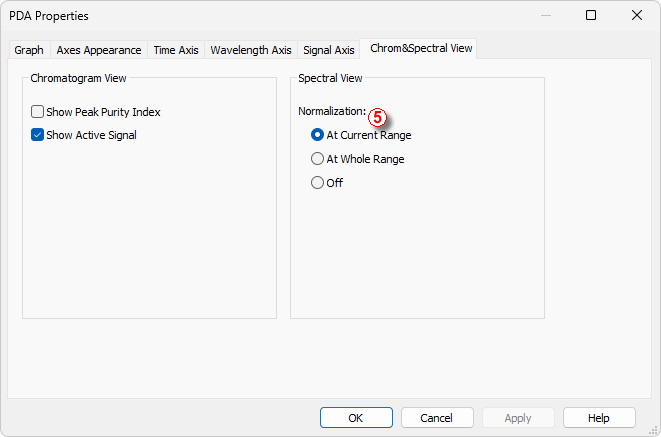
To compare spectra it is recommended to normalize their view. Right click into Spectral View and select Properties. In PDA Properties dialog navigate to Chrom&Spectral View tab and select Normalization: At Current Range ⑤.