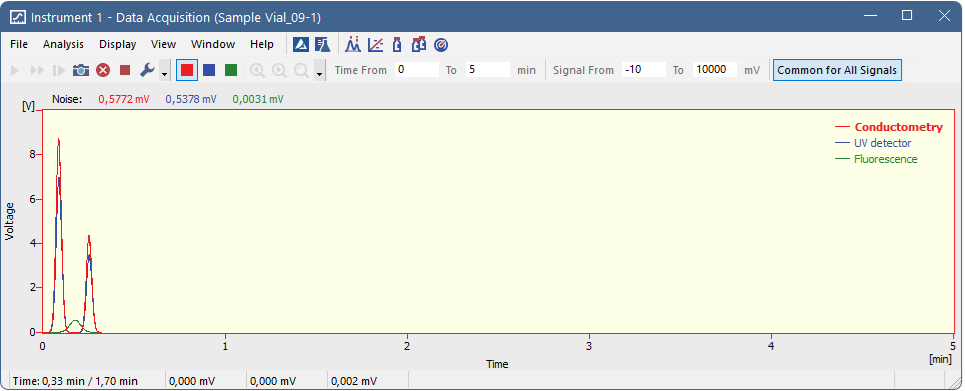
Data Acquisition
Displays the signal from detectors configured on the given Instrument. The Data Acquisition window can be opened using the Monitor - Data Acquisition command or using the  icon in the
Note:
It is possible to switch between signals and hide/display them in the same way as in the Chromatogram window.
Note:
When the analysis is started, it takes some time to initialize the detector (200 ms for DataApex Converters). In this time, the data is not valid.
The window contains two fundamental parameters, Time and Signal. In the default setting (if you have the Context Axes item set in the View menu) the function of these two parameters will be dependent on whether an analysis is currently taking place:
a) Analysis not running (state STOP, WAITING or IDLE):
The axes are set as Floating Axes.
Sets the width of display window in minutes (e.g. 0 - 20 min). Should the signal exceed the set time, the window will be reset and the signal will once again be displayed from the start. Maximum value is 300 min.
Sets the height of display window in units set for the given active signal. (in range 0.01 - 1000000000 mV or equivalent units). The window dynamically monitors the course of the signal and is automatically redrawn after reaching the upper or lower edge for the given signal.
b) Analysis running (state RUNNING):
The axes are set as Fixed Axes. This means that if the current time or the level of the signal exceeds any of values set, the window is not redrawn and the signal is not displayed.
Sets the fixed range of displayed time in minutes.
Sets the fixed range of the signal in units selected for the given active signal.
Note:
Automatic switching between the fixed and floating range of axes, depending on whether analysis is taking place or not, may be canceled by switching the axes display in the View menu from Context Axes to Fixed Axes or Floating Axes (for more details see also chapter View)
If selected (highlighted in orange) the Y axis is common for all signals as is the range selected either in the Signal Range (when Analysis is not running) or in the Signal: from… to… (when Analysis is running). All signals are shown proportionally, so their Y value can be approximately read from the Y axis.
Note:
If the Common for All Signals is not selected, the Y axis is scaled to the active (i.e. selected) signal only. The remaining signals are not shown adequately to the Y axis of the selected signal.

The Data Acquisition window contains the following items in the status bar:
Displays the current time of an analysis in minutes (only during the measurement).
Displays the immediate value of all signals connected to the Instrument, along with appropriate signal units.
Note:
If the detector range exceeds the tolerance limit by ± 1.285%, the OVER string in red lettering will be displayed in the part of the status bar corresponding to the detector.
If it has been defined, using the File - Set Background Chromatogram command, the name of the background chromatogram will appear in the status bar. If the workstation is in the WAITING state, the chromatogram will not be displayed and its title in the status bar will be shaded gray.
If it has been defined in the Method Setup - Advanced dialog and the display has been set using the File - Show Subtraction Chromatogram command, the name of the subtraction chromatogram will appear in the status bar.